
Canada's Quality of Life Hub is currently in development. We need your help! If you have ideas or thoughts for what you'd like to see on the Hub, Statistics Canada would love to hear about it. Your input is invaluable as we continue to develop the Quality of Life Hub.
Biennial Review of the Quality of Life Indicators
Prepared by the Centre for Social Data Insights and Innovation, Statistics Canada for The Director General-level Committee on Quality of Life Measurement and Implementation
February 2025
Table of contents
- Introduction
- Objectives of the Review
- Achievements to Date
- Governance
- Framework Development
- The Quality of Life Hub
- Alternative Sources for Quality of Life Indicators
- Increasing the Frequency of Key Quality of Life Indicators
- Disaggregated Data
- Insights and Dissemination
- Multilateral Engagement
- Framework Alignment
- Use of Quality of Life Indicators
- Performance of the Quality of Life Hub
- Gathering Data User and Data Producer Perspectives on the Quality of Life Indicators
- Conclusion and Recommendations
- Appendices
Introduction
In operation since 2021, the Quality of Life Statistics Program has made substantial progress in establishing itself as a truly horizontal effort with clear links to the federal policy cycle. The Quality of Life Framework was developed to better support decision-making and budgeting by improving quality of life measures, highlighting important data gaps, and bringing together key economic, social and environmental datasets through an integrated user interface, the Quality of Life Hub.
A tangible result from the program so far is improvement in the granularity, timeliness and relevance of insights on the quality of life of people living in Canada. For example, a recent publication in Statistics Canada's Insights on Canadian Society - Charting change: How time-series data provide insights on Canadian well-being - highlights how more frequent data on social phenomena have enabled us to monitor how people in Canada have coped with a period of substantial transition through the end of the COVID-19 pandemic, as well as the rising cost of living that followed.
Since Statistics Canada's last update on the Quality of Life Framework in April 2023, the Agency has conducted its first biennial review of the relevance of the quality of life indicators, a commitment to ensure the Framework remains relevant over time. This initial review focused on the perspectives of the federal community of data users on how the Framework could better meet their needs as its applications in the policy cycle progress. This report has five components:
- Provide an overview of the achievements of the Quality of Life Statistics Program during its initial years of operation.
- Summarize feedback received from the Program's community of data users and producers.
- Establish a "go forward" schedule for the collection and dissemination of quality of life data.
- Establish a workplan for the next two years' of the Program's operations.
- Communicate (at a high level) the intended scope of the next biennial review, to be completed in 2026.
Objectives of the Review
The overall objectives of the review as established in spring 2024 are as follows:
- Review and revise Statistics Canada's governance mechanisms for the Quality of Life Initiative to ensure it is well-supported in its next phase of implementation.
- Determine the relevance of quality of life indicators to support decision-making and other government processes, such as the budget process, the departmental planning process, spending or program reviews, and Treasury Board submissions.
- Ensure the continued alignment of the Quality of Life Framework indicator set with other related policy and measurement strategies or frameworks, including the Canadian Indicator Framework, the Gender Results Framework, the Canadian Environmental Sustainability Indicators and the Federal Sustainable Development Strategy.
- Review and document the performance of the Quality of Life Hub in its first two years of operation.
- Establish a plan and critical path to complete the Framework development process (remaining indicator definitions).
- Develop recommendations for stabilizing and improving the coherence of the data ecosystem for quality of life indicators (predictable and appropriate time intervals for data collection for monitoring purposes, improvements to interoperability).
- Lay the foundation for a more comprehensive review of the initiative in two years' time.
Beyond this, the review represents an opportunity for Statistics Canada to summarize its various efforts over the early years of the Quality of Life Statistics Program’s operations to further develop quality of life data. These efforts have included conceptual alignment with other measurement and policy frameworks with overlapping content; improving collection frequency for indicators (particularly social indicators); enhancing geographic breakdowns; and filling data gaps for Indigenous peoples and persons with disabilities.
Background and Strategic Drivers of the Quality of Life Statistics Program
Canada's Quality of Life Framework traces its origins to a 2019 mandate letter for the Minister of Middle Class Prosperity and Associate Minister of Finance. They were mandated to lead work within the Department of Finance to better incorporate quality of life measurements into government decision-making and budgeting, to measure societal progress in a way that goes beyond gross domestic product (GDP). Budget 2021 then allocated $13.8 million over 5 years starting in 2021/2022 and $2.3 million ongoing for Statistics Canada to develop a comprehensive program of quality of life statistics to fill key data gaps, and to develop and launch an online hub to make data more accessible. These investments were complemented with others to establish the Disaggregated Data Action Plan, the Census of the Environment, and to develop Indigenous-led, distinctions-based data strategies.
Figure 1: Timeline of milestones for the Quality of Life initiative
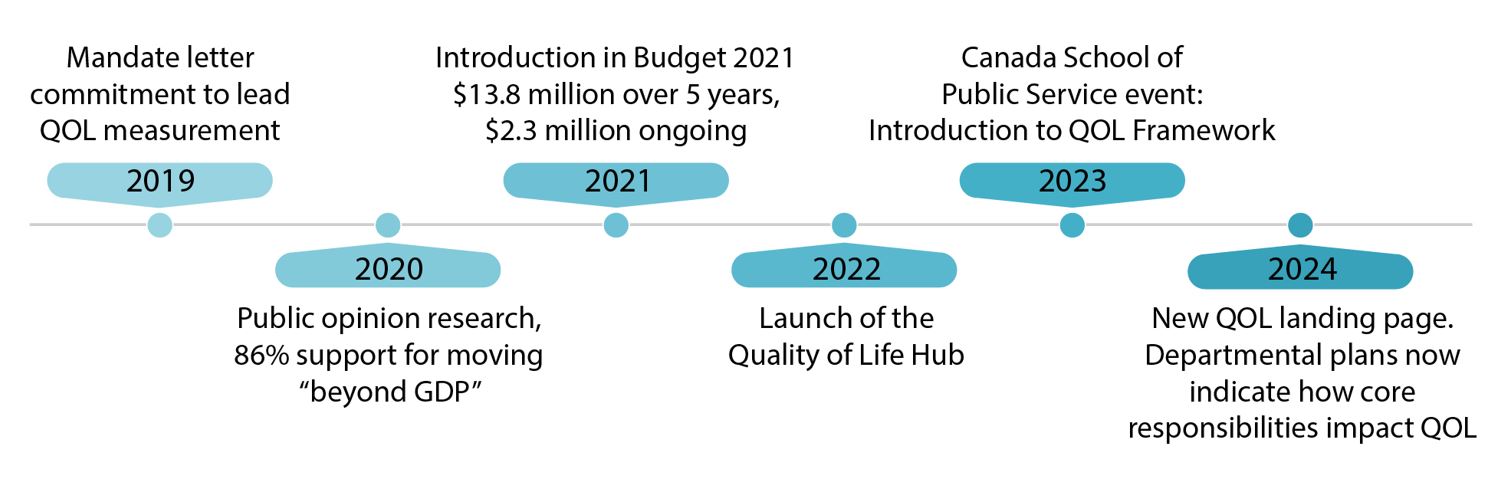
Description - Figure 1: Timeline of milestones for the Quality of Life initiative
This timeline shows a series of six dates from 2019 to 2024. It is divided into six sections along one line with a point for each year that describes a key milestone in the development of the Quality of Life Framework.
2019: Mandate letter commitment to lead Quality of Life measurement
2020: Public opinion research, 86% support for moving "beyond GDP"
2021: Introduction in Budget 2021, 13.8 million dollars over 5 years, 2.3 million dollars ongoing
2022: Launch of the Quality of Life Hub
2023: Canada School of Public Service event: Introduction to Quality of Life Framework
2024: New Quality of Life landing page. Departmental plans now indicate how core responsibilities impact quality of life
Source: Statistics Canada
In December 2021, mandate letters reconfirmed the government's commitment to the initiative and transferred leadership to the Treasury Board Secretariat for implementation, signaling an expansion of the policy uses of the Framework beyond its original budgeting applications. The Department of Finance continues to lead on the budgeting aspects of the initiative, with each budget since 2021 featuring an Impacts Report, which summarizes the expected quality of life impacts of each budget measure, along with Gender-based Analysis Plus information. In March 2022, the Quality of Life Hub was launched to provide information on the well-being of Canadians in one centralized location, a key mechanism to support these efforts. Implementation of the initiative continued through 2023 and is ongoing.
Beyond these important domestic drivers, global efforts to get beyond GDP within multilateral institutions have gathered a great deal of momentum in recent years, taking their inspiration from the domestic experiences of places like Canada. These include an effort led by the OECD's new Centre on Well-being, Inclusion, Sustainability and Equal Opportunity (WISE) overseeing the longstanding "How's Life" initiative; the United Nations Economic Commission for Europe (of which Canada is a member) program of work to develop guidelines on the development of national well-being frameworks; and coordinated efforts by the UN's Network of Economic Statisticians and the Friends of the Chair on Social and Demographic Statistics (within both of which Canada plays a leading role), which aim to develop recommendations on moving the System of National Accounts beyond GDP, supported by a system of social and demographic statistics. These efforts are creating standards and guidelines for national statistical offices (NSOs) like Statistics Canada to rely upon in their domestic efforts to create high quality and comparable statistics on the sustainable well-being of their populations.
Achievements to Date
The Quality of Life Statistics Program has made substantial progress on a number of fronts since its inception. The following sections provide a summary of the Program's key milestones in the first two years of its operations.
Governance
Interdepartmental
As noted above, policy leadership of the initiative shifted from the Department of Finance to the Treasury Board Secretariat (TBS) with the December 2021 mandate letters. These mandate letters also directed all ministers to apply quality of life indicators in decision-making. With these changes, the scope of implementation of the Framework expanded to include applications beyond the Budget. This effort (led by TBS) is ongoing. As a result, the salience of the quality of life indicators among its primary community of federal users has increased, and there are new user needs to consider as the Program develops.
To accommodate this changing landscape, the Program (in partnership with TBS) refreshed its interdepartmental governance in 2024. Since 2019, as a whole-of-government effort, the Quality of Life Initiative has benefited from a set of senior Assistant Deputy Minister (ADM) and Director General (DG) level committees. These have evolved over the years as the needs of the initiative have shifted. For the Program, this interdepartmental committee is a crucial forum where it can keep abreast of data user needs, close the data-to-policy gap, and maintain important touchpoints within policy departments to ensure the Program remains aligned with related efforts.
The refresh was intended to bring together governance of Quality of Life data and implementation into one body and ensure that the Program remains well-supported in the next phase of implementation. The effort produced refreshed Terms of Reference for the group, and reconfirmed its membership, emphasizing a need for well-engaged membership drawn from all domains of policy. This effort also re-established the director-level working group to support the main DG committee (which continues to be co-chaired by Statistics Canada and TBS).
In-Agency
Within Statistics Canada, the Program is relatively unique. Rather than being funded as a stand-alone statistics program, it is a horizontal effort within the Agency, and it is intended to bring together data sets that speak to the determinants of quality of life of people living in Canada—drawing on existing efforts within the Agency and beyond. In practice, the Program integrates a wide range of data sources, including the census, household surveys, and administrative data holdings, which are drawn from various fields responsible for economic, environmental and social/health/labour statistics.
This is a complex undertaking and a new way of working for the Agency. To support these efforts, the Program used this review as an opportunity to establish in-Agency governance. The goal was to ensure the Program benefited from an appropriate mechanism, with the right accountabilities, to effectively deliver on its horizontal mandate.
This structure was approved by the Assistant Chief Statistician responsible for the Quality of Life Statistics Program. It delegates the responsibility for quality of life indicators to the responsible directors of the relevant subject matter areas, while bringing them together in a committee structure jointly responsible for the Framework as a whole. This will serve as an internal decision-making body for the Program as it continues to evolve.
Figure 2: Internal governance structure for the Quality of Life Statistics Program at Statistics Canada
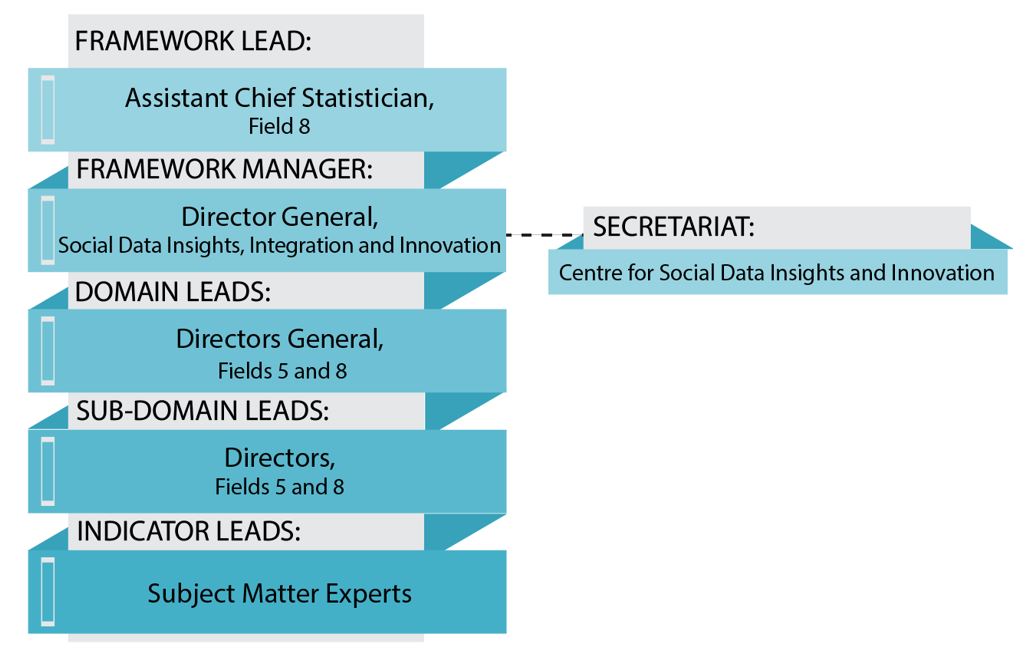
Description - Figure 2: Internal governance structure for the Quality of Life Statistics Program at Statistics Canada
This image illustrates the internal governance structure for the the Quality of Life Framework. It is a ladder-shaped graphic that shows five levels of internal governance required for the Framework.
Starting at the bottom are the indicator leads, who are subject matter experts in their Field.
Sub-domain leads are the second level up, who are Directors from Fields 5 and 8.
Domain leads are the third level, who are Directors General from Fields 5 and 8.
The Framework manager is the fourth level up, who is the Director General for Social Data Insights, Integration and Innovation. Horizontal to this is the Secretariat, which is the Centre for Social Data Insights and Innovation.
At the top of the graphic is the Framework lead, who is the Assistant Chief Statistician of Field 8.
Source: Statistics Canada
Framework Development
A key effort in the initial years of the Program's development was the establishment of measurable definitions for each of the indicators. This involved an iterative process of engagement with data producers and users, under the auspices of the Program's governance committees. This process was described in detail in the program's first update, and the Program remains well ahead of its targets. One of the current review's objectives is to finalize the definitions process as part of the workplan for the next two years of operations, though the Program will need to revisit and revise definitions on a case-by-case basis as concepts evolve to keep them relevant.
A key area of focus will be to establish or re-establish (as appropriate) definitions for concepts that speak to public safety and security, as well as global affairs portfolios, which reportedly lack explicit links in the Framework. Initially, this will involve defining existing concepts like misinformation, trust in media, and Canada's place in the world, among others.
The Quality of Life Hub
The Quality of Life Hub (the Hub) was launched in March 2022, and has since experienced exponential growth and engagement. As of September 2024, data are available for most indicators on the Hub, which is well-used by government departments as well as users across Canada and from outside the country. The performance of the Hub is reviewed further on in this report.
In April 2022, the Quality of Life Hub was launched as a beta version through Statistics Canada's Dissemination team, with the intention of building a more interactive Hub with IT's support. Over time, this beta hub has become the full-scale Hub, and it is steadily improving to better provide users with data that showcase changes over time. Below are some key improvements since launch:
- The entry point for users is more data-forward on the Hub Landing Page. Drawing on the Framework's headline indicator set, the landing page now features visual trend lines for those indicators, providing a snapshot of how key determinants of quality of life are changing and how Canada compares internationally. In addition, the Hub Landing Pages also features important highlights from emerging research.
- The Hub team has developed and offered tools, including the Selected indicators of quality of life in Canada dashboard, that empower policy analysts to create their own narratives from the data using maps and filters that show differences across population groups and geographies on key indicators at each point in time. In addition, indicator pages provide visual depictions of movements over time.
- The Hub supports data analysts and researchers with metadata so they can view all the places any indicator exists across all Statistics Canada products (for example, micro-data files, aggregate data releases, analysis that features the indicators, visualization products which feature it, or other frameworks it is present in).
Modernization of the Quality of Life Hub
The Quality of Life Hub is in the process of iterative upgrades to better satisfy the needs of three main user groups: the general public (including media), policy analysts, and the academic community. With a growing user base, a large number of returning users, and ongoing data collection, the intention is to have users discover the latest trends in statistics more easily and earlier when navigating the Hub. The Quality of Life Statistics Program will use web analytics and conduct focus groups to understand how users are engaging with the Hub, which will drive future development. The goal is to increase engagement metrics such as daily active users, time spent on page, referrals to relevant products, and use of the Hub in supporting research and briefings.
Over the next two years, the team will look to decentralize the page updating process so that other data providers can submit content for the Hub. The objective is to support frequent updates that can keep the community interested in quality of life data fully informed, all with the broader goal of ensuring users can reach the content they need intuitively and within three clicks.
Figure 3: Objectives of the Quality of Life Hub
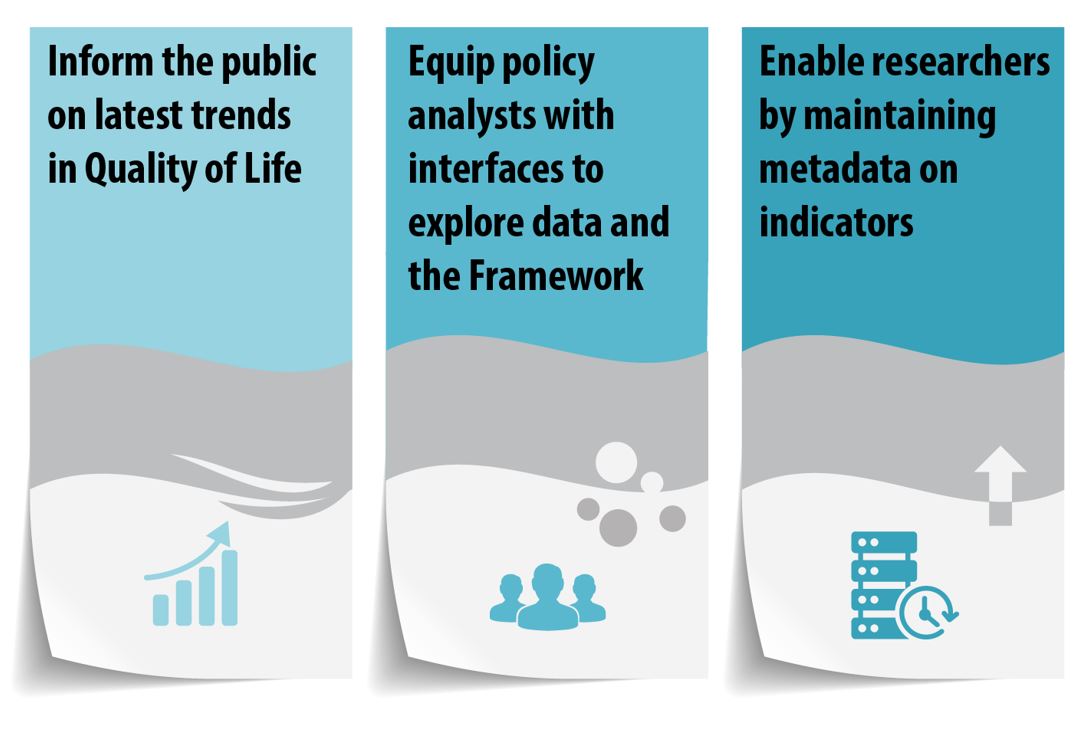
Description - Figure 3: Objectives of the Quality of Life Hub
This figure illustrates the three objectives of the Quality of Life Hub. Each objective is represented by a block with two components: text and a graphic at the bottom.
The left block says "Inform the public on the latest trends in Quality of Life." The graphic is a bar chart with an arrow curving upward.
The middle block says "Equip policy analysts with interfaces to explore data and the Framework." The graphic is a group of three people.
The right block says "Enable researchers by maintaining metadata on indicators." The graphic is a stack of computer servers with a clock.
Source: Statistics Canada
Figure 4: Ideal state for the Quality of Life Hub
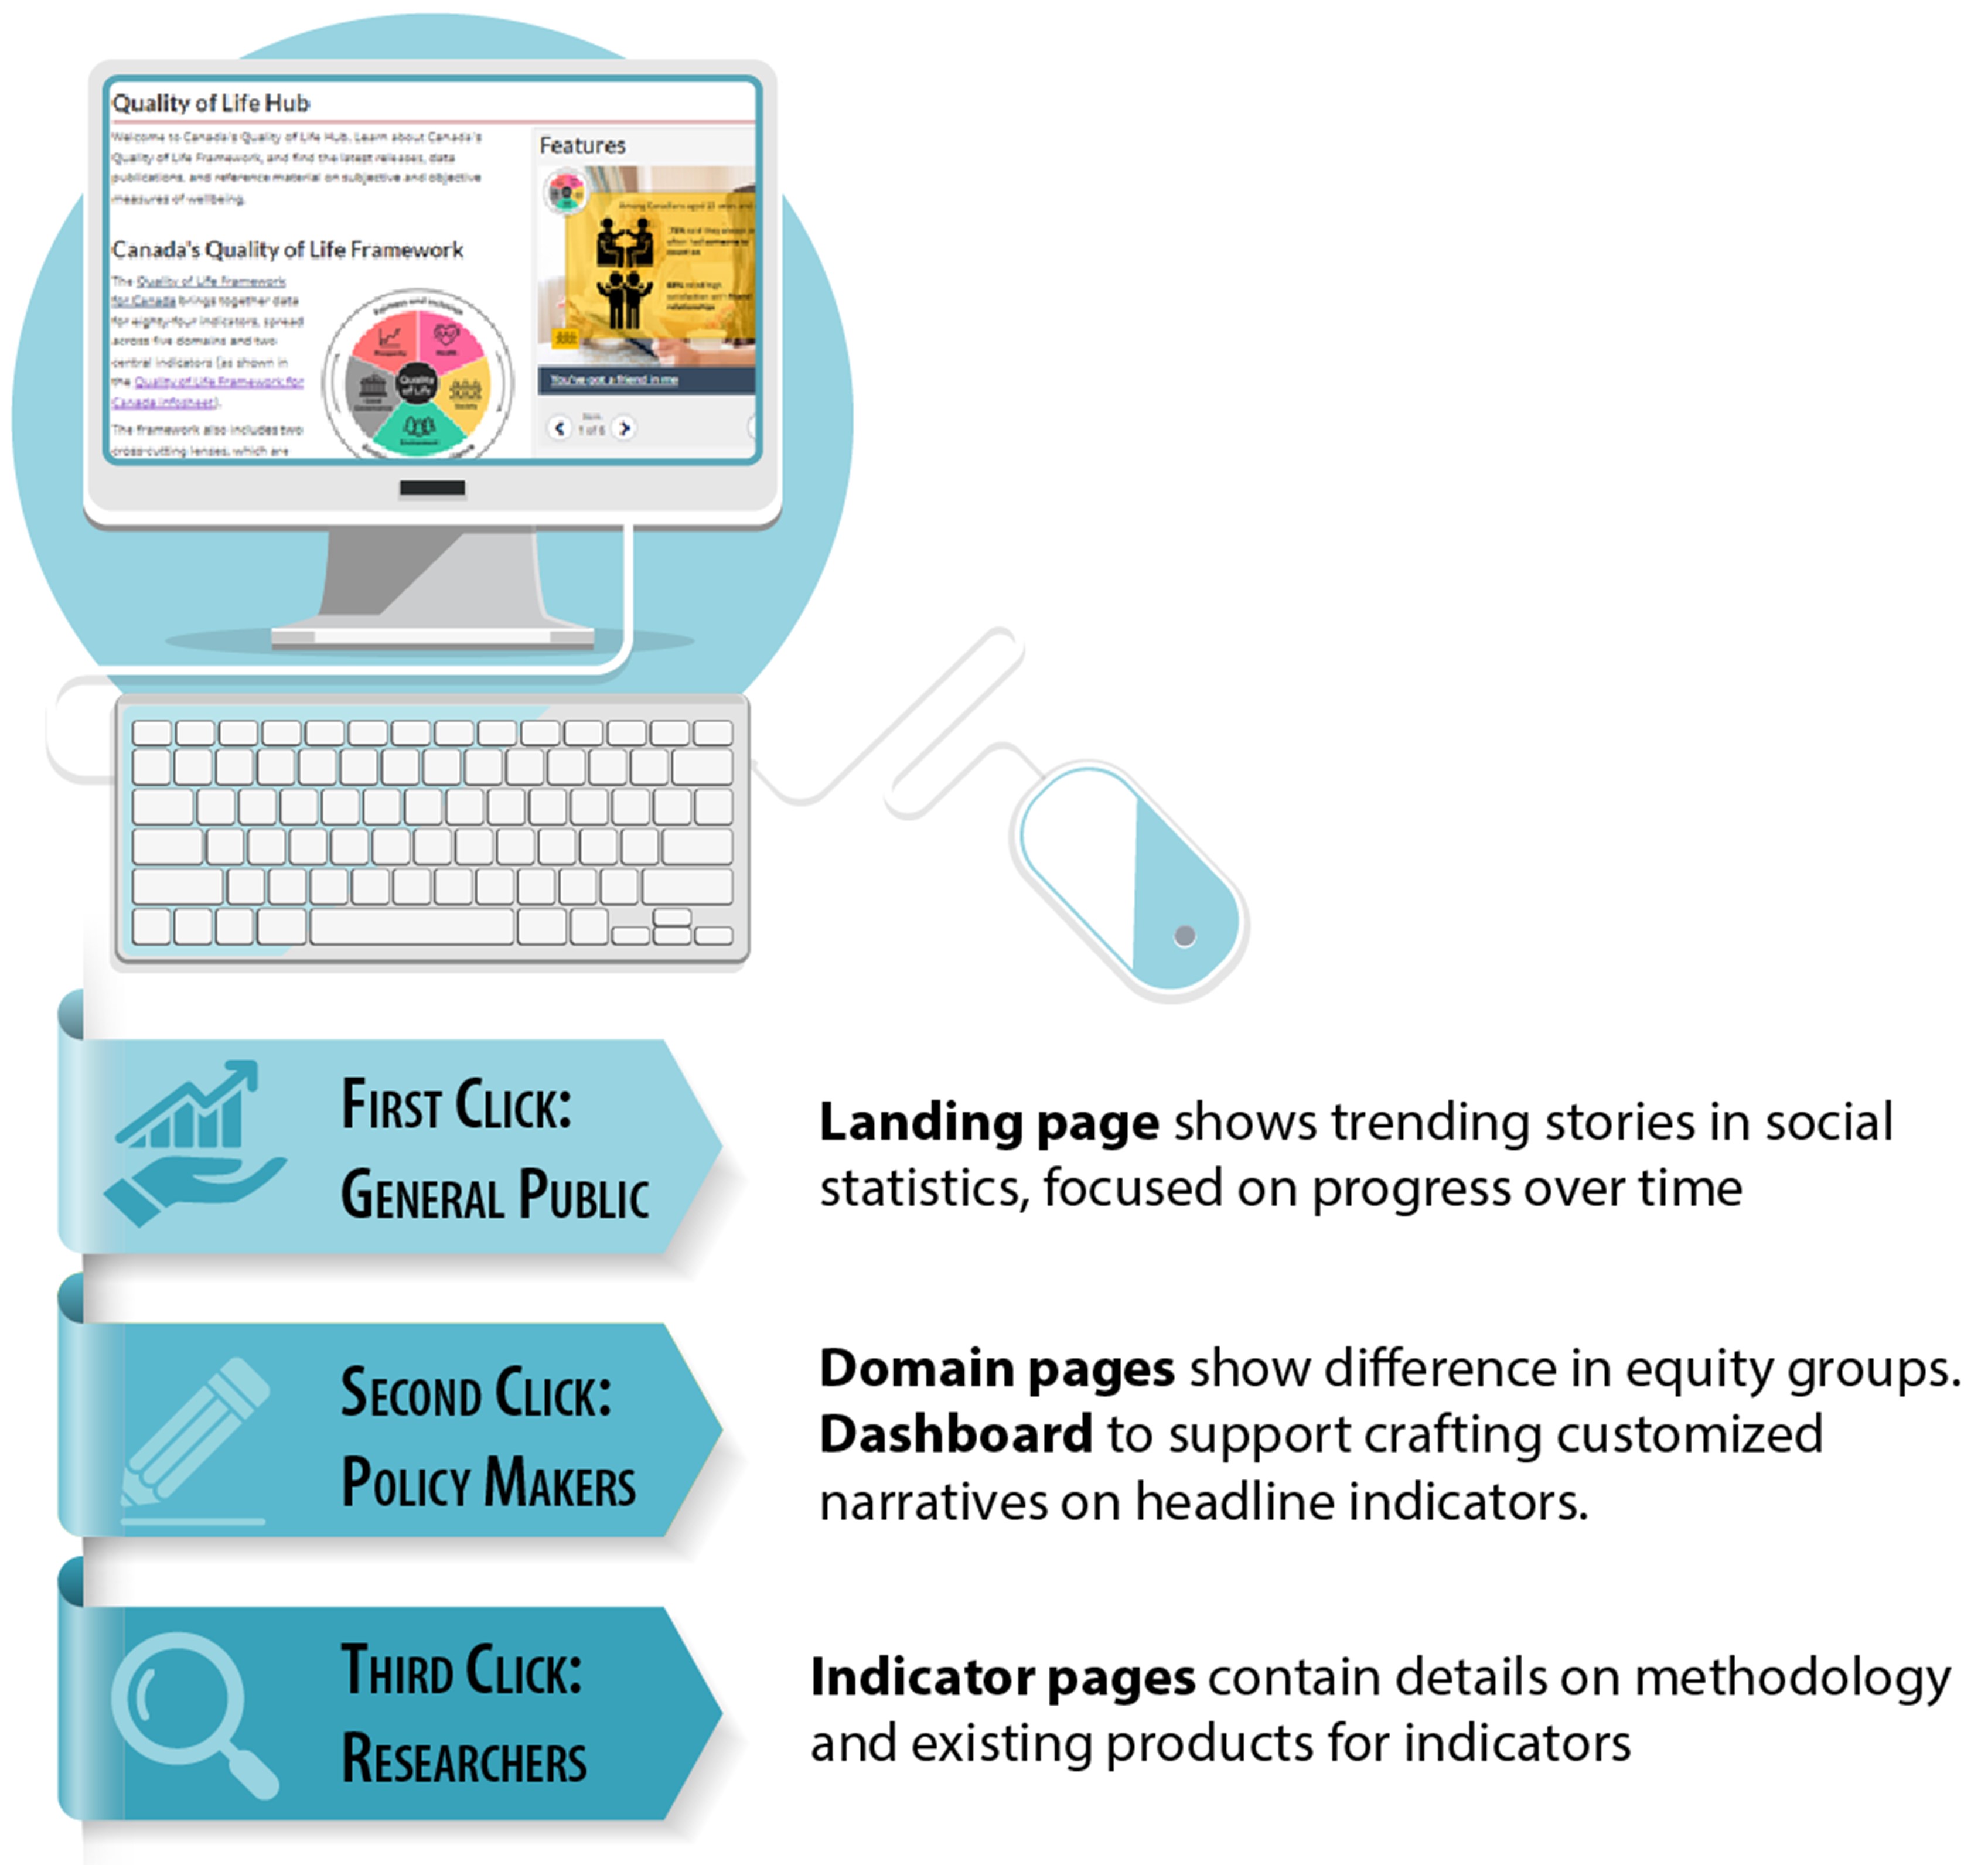
Description - Figure 4: Ideal state for the Quality of Life Hub
This figure is composed of an image of a computer screen showing the Quality of Life landing page, with a computer keyboard and mouse below. Under the computer are a series of descending flags and text that represent each click from a user as they navigate through the interface for the Quality of Life Hub.
The first flag consists of an image of an ascending bar chart with the text "First Click: General Public." Secondary text to the right states "Landing page shows trending stories in social statistics, focused on progress over time."
The second flag consists of an image of a pencil with the text "Second Click: Policy Makers." Secondary text to the right states "Domain pages show difference in equity groups. Dashboard to support crafting customized narratives on headline indicators."
The third flag consists of an image of a magnifying glass with the text "Third Click: Researchers." Secondary text to the right states "Indicator pages contain details on methodology and existing products for indicators."
Source: Statistics Canada
The landing page has been redesigned to showcase changes over time. Currently, it reflects the latest estimates for headline indicators, and over the next two years it will be iteratively transformed, moving from telling one story per indicator to a few main stories in social statistics overall, with interactive, embedded widgets for users to filter by population group. The current landing page provides an overview of how the country is doing and serves as a briefing tool for individuals working with social statistics. The Quality of Life Hub will focus on highlighting nuances in the social statistics it presents and showcasing previously unknown phenomena in economic and environmental statistics. The landing page will also focus on international comparisons and framework alignment, and it will feature relevant partner work and research so the public can stay up to date with quality of life research and developments.
The domain pages are being redesigned to showcase between-group differences and changes to the distribution of outcomes across the population, with a focus on within-country comparisons. The featured dashboard Selected indicators on quality of life in Canada has been redesigned to include more indicators and updated data, in addition to a new colour scheme that better meets accessibility requirements. More enhancements are planned to help users craft their own stories on changes over time and between-group differences. There is a tentative plan to move individual indicator metadata to a new platform, where users can explore metadata, aggregate statistics, and charts all in one place.
Alternative Sources for Quality of Life Indicators
Alternative data, which include statistical use of administrative data, publicly available data and project-specific external data, offer several benefits to survey programs; for example, they can be used to supplement or replace existing survey data. Alternative data also can help address the issue of declining survey response rates.
The Program has always incorporated alternative data since its inception in 2021. Among existing quality of life indicators, 12 of the 84 indicators are already completely derived from alternative and administrative data, including the Incarceration rate indicator, which is derived from provincial and territorial administrative records, as well as the Voter turnout indicator, which is captured using administrative data from Elections Canada. Eighteen of the indicators use a combination of survey and administrative data. At minimum, most surveys use income tax data to replace household income information. Others rely more heavily on administrative data than survey data; for example, the Health adjusted life expectancy indicator is almost entirely derived from administrative data.
However, given that more than half of the indicators (43) are currently being measured through survey data only, there are opportunities to further reduce reliance on surveys by exploring alternative data sources. Furthermore, another 10 indicators do not yet have a data source identified, and alternative data sources could be used to fill those data gaps in some cases.
While subjective measures of well-being are important to understanding how Canadians are doing, greater use of alternative data sources, including administrative data, could enhance the timeliness and granularity of insights. Moreover, departments through interdepartmental governance mechanisms are calling for better tools to understand the effectiveness of their program interventions in improving Canadians' quality of life.
Historically, direct collection was the principal means of acquiring data about people for official statistics on social measurements, including quality of life indicators. However, in this era of "datafication" and the proliferation of new data sources and technologies to analyze them, opportunities to go beyond survey measurement exist, though they largely remain concealed in the context of official statistics on social measurements. Lack of funding for experimental work and ongoing statistical program delivery remains the core reason why these opportunities have not been seized.
The work is in early feasibility stages and will initially focus on a few test candidate indicators. This effort will be scoped in early 2025 and may involve either complementing existing survey vehicles, replacing a survey data source, or identifying a data source for indicators that do not already have one.
Increasing the Frequency of Key Quality of Life Indicators
Following the initial focus on selecting and then defining indicators in the Framework, much of the Program's first two years of operation was focused on increasing the frequency of select quality of life indicators, using a variety of vehicles in use across the Agency. This is necessary to strengthen the evidence-to-policy feedback loop, as some of the social statistics that are more prominent in the Framework have historically been collected infrequently (e.g., every five to seven years).
Consistent with its mandate to bring together diverse data sets, the Program draws upon a mix of new and existing vehicles, drawing upon the full spectrum of Statistics Canada's available collection vehicles, including the Census, the System of National Accounts, the System of Economic and Environmental Accounts, a variety of household surveys, and administrative data sets. The goal has been to bring the collection and dissemination frequency of most quality of life indicators up to at least an annual frequency where possible, which is generally consistent with the needs of policy users as articulated by them in their feedback to the Program (summarized later).
A core set of quality of life indicators have been monitored over a period of time by the Canadian Social Survey, a new omnibus survey with rotating content that allows for collection of new content on emerging issues. The Program recently published a paper that examined time-series trends in three key quality of life indicators - Life satisfaction, Financial well-being and Future outlook, yielding important insights into how Canadians fared through the pandemic and the inflationary period that followed.
The Program will continue to work with data producers across the Agency in its ongoing effort to integrate data sets and improve their timeliness for use in policy.
Chart 1: Percent reporting high life satisfation, Canadians aged 15 years or older, selected sociodemographic or geographic groups, 2021 to 2024
.. not available for a specific reference period
Source: Statistics Canada, Canadian Social Survey, Q3 2021 – Q1 2024 (excluding Q1 2023)

Description - Chart 1: Percent reporting high life satisfation, Canadians aged 15 years or older, selected sociodemographic or geographic groups, 2021 to 2024
Selected Age groups
Collection period
Q3 2021
Q4 2021
Q1 2022
Q2 2022
Q3 2022
Q4 2022
Q1 2023
Q2 2023
Q3 2023
Q4 2023
Q1 2024
Percent
25 to 34 years
47.2
45.4
47.3
47.1
48.9
37.4
..
44.5
44.2
36.7
36.9
65 years and over
63.9
62.6
60.1
61.8
64.7
58.9
..
60.7
60.2
59.9
62.4
Many indicators in the Society and Good Governance domains will benefit from more frequent collection, for example through use of the Canadian Social Survey, or as a result of the ongoing modernization of the General Social Survey Program. Indicators that will benefit from increased frequency include Positive perceptions of diversity, Participation in cultural or religious practices, recreation or sport, Sense of pride/belonging to Canada, Sense of belonging to local community, Someone to count on, Trust in others and Satisfaction with personal relationships (family and friends).
The Survey on Canadians' Safety will now be fielded every three years instead of every five to seven, which will benefit quality of life indicators such as Personal safety and Perceptions of neighbourhood safety after dark. Satisfaction with time use will now be collected biannually on the Canadian Social Survey between cycles of the Time Use Survey.
To support more frequent reporting of health data, indicators collected in the Canadian Community Health Survey will now be disseminated every six months instead of annually. This will result in more timely data for indicators including Self-rated mental health, Self-rated health, Physical activity, Timely access to primary care provider, Unmet needs for mental health care and Unmet needs for home care.
These efforts will continue under the work plan. As new indicators are defined, this process will also consider recommended collection and dissemination frequencies for the respective indicators in development. More substantially, the Program will demonstrate the value of time series through its dissemination activity and enhanced visualization on the Hub (for example, the recently refreshed landing page).
Disaggregated Data
The Program maintains an important relationship with the Disaggregated Data Action Plan and other efforts to improve the disaggregation of quality of life data. Accordingly, it has leveraged a variety of collection vehicles, such as new ad hoc web panel surveys, which provide increased levels of disaggregation for select population groups like immigrants, racialized groups and Indigenous peoples. Other vehicles, like the Canadian Social Survey, allow for the pooling of data over several waves to enhance available disaggregation. A summary of some key efforts to improve levels of disaggregation follows. There is a series of efforts either completed or at various stages of development under the work plan for the coming two years:
Unlocking the Data with Standardized Data Tables
Standardized data tables are necessary to capture a complete snapshot of quality of life outcomes for specific groups across different data sources. In 2022/2023, the Quality of Life Statistics Program secured funding to develop a proof of concept for standardized socio-demographics for a sub-set of three quality of life indicators. These standardized socio-demographics could be used across surveys to disseminate data tables for quality of life statistics. This work was completed in consultation with data providers and subject matter experts, and it looked at standardizing disaggregation for gender, age, racialized groups, immigrant status and disability status, among others. Further ambitions include breakdowns for municipal-level data on Indigenous distinctions-based groups, but there are limitations based on data quality, mainly due to sample size. Data tables for indicators collected in the Canadian Social Survey (CSS) are now disseminated according to these recommendations, and as more data providers adopt these standards, data will become increasingly valuable to analysts.
Standardization of Geography Concepts
In consultations, data users have stressed that more granular geographic disaggregation at the sub-regional level are useful, as each jurisdiction benefits from having data on their specific population. Starting in 2023/2024, the Quality of Life Statistics Program embarked on exploratory research to incorporate additional levels of standardized geography in the CSS to garner greater insights from existing data. New visualizations will feature data at the provincial, Census Metropolitan Area (CMA)Footnote 1, Census Division (CD)Footnote 2, and Census Subdivision (CSD)Footnote 3 levels, where available. A series of short reports will summarize the key findings for various audiences.
The Survey Series on People and their Communities
The Quality of Life Framework establishes a broad set of priority indicators, which is helpful in prioritizing data collection needs for vulnerable groups that are sometimes under-represented in general surveys. Although not a continuing vehicle, the Survey Series on People and their Communities has helped to fill disaggregation data gaps for the immigrant population and racialized groups for the following quality of life indicators:
- Sense of pride/belonging to Canada
- Discrimination or unfair treatment (at work)
- Sense of belonging to local community
- Confidence in institutions
- Trust in people
- Job satisfaction
- Positive perceptions of diversity
- Voter turnout
- Financial well-being
- Life satisfaction
- Sense of meaning and purpose
- Someone to count on
- Loneliness
- Future outlook
- Satisfaction with personal relationships
- Misinformation/trust in media
- Self-rated mental health
- Self-rated health
- Satisfaction with time use
- Satisfaction with local environment
- Participation in cultural or religious practices, recreation or sport
Distinctions-based Quality of Life Data for Indigenous Peoples
To help fill Indigenous data gaps in the Framework, Statistics Canada will collect several indicators in a new web panel: the Survey Series on First Nations People, Métis and Inuit (SSFNPMI). The quality of life indicators provided a reference point for collaboration with Indigenous partners to identify their priorities for data collection. While not an ongoing collection vehicle, the SSFNPMI is funded through the Transformational Approach to Indigenous Data (TAID) and will collect data on 14 indicators:
- Timely access to primary care provider
- Sense of meaning and purpose
- Unmet health care needs
- Future outlook
- Self-rated mental health
- Self-rated health
- Unmet needs for mental health care
- Financial well-being
- Cost-related non-adherence to prescription medication
- Discrimination and unfair treatment (in healthcare and workplace settings)
- Household emergency preparedness
- Drinking water
- Life satisfaction
- Confidence in institutions (related to emergency response – the police, firefighters and emergency medical services)
What is a web panel?
A web panel is a series of surveys administered online to a group of respondents who have voluntarily agreed to participate.
Quality of Life Data for Persons with Disabilities in Canada
The Quality of Life Statistics Program was initiated with the goal of disaggregating quality of life statistics for key population groups, including persons with disabilities. This is integral to the cross-cutting Fairness and Inclusion lens, which aims to provide distributional insights across all relevant domains and indicators. In 2024/2025 the Disaggregated Data Action Plan (DDAP) program committed funding for a study that will explore differences in select indicators among persons with disabilities. Data from two sources will be used—2022 Canadian Survey on Disability (CSD) and various cycles of the Canadian Social Survey (CSS). Results will be available in 2025 as an article in the publication Insights on Canadian Society (ICS).
Insights and Dissemination
Consistent with the holistic nature of the Program, Statistics Canada has released a wide variety of products for quality of life indicators including dozens of data tables, infographics, Daily articles, data visualizations and StatsCAN Plus articles. The Hub is kept up to date to ensure that these releases are promptly linked on the relevant indicator pages. Collection and dissemination data gaps have been filled through a variety of collection vehicles for several quality of life indicators, including Trust in the media via the Canadian Social Survey and Access to fair and equal justice (civil component) via the Department of Justice's National Justice Survey.
Statistics Canada has filled several dissemination data gaps for quality of life indicators through a variety of releases, including an infographic and article on Loneliness, an infographic and article on Someone to count on, an infographic on Household emergency preparedness, an article on Trust in media and an article on both Trust in the media and Confidence in institutions. Statistics Canada has also released a data visualization product that is consistently updated for several quality of life indicators collected on the Canadian Social Survey. Quality of life releases are also garnering significant media attention—for example, a recent publication on the impacts of rising prices that included several quality of life indicators like Life satisfaction, Financial well-being and Future outlook. Another release, Charting change: How time-series data provides insights on Canadian well-being, illustrates the value of consistent data collection in order to measure and monitor trends.
Multilateral Engagement
Beyond its domestic applications, the Quality of Life Framework has emerged as one of Canada's primary contributions to an ongoing set of efforts lead by the United Nations Statistical Commission (UNSC) to move beyond GDP in statistical measurement and take a more holistic approach to measuring the progress of nations. At its 54th session in 2023, the Commission launched the Friends of the Chair (FOC) Group on Social and Demographic Statistics, tasked with reviewing the social pillar of statistics over a period of three years (2023 to 2026). This ambitious effort involves three streams of work, including one chaired by Statistics Canada, which is tasked with developing advice on the features of a conceptual framework for social and demographic statistics, drawing on best practices from participating members.
This work is evolving alongside a parallel effort within the UNSC in the economic statistics domain, also seeking to move beyond GDP through a new approach to the production and dissemination of social statistics that can complement existing economic and environmental measures. Both efforts are looking ahead in their own ways to establish the statistical foundation the global community needs for a successor strategy to the Sustainable Development Goals (SDGs), following the 2030 deadline for the current suite of targets and recognizing the need for domestic flexibility.
Within these discussions, Canada's experience with the Quality of Life Statistics Program has established it as a leader and important contributor to this work, especially as the global statistical community looks to develop statistical standards for the kind of holistic thinking that the Framework embodies. In the context of the FOC table, for example, the Framework is already informing a set of "building blocks" for a mature system of demographic and social statistics: people, places, relationships, time and outcomes. Canada, alongside Morocco, is co-leading efforts to inform the relationships component. This is analogous to foundational concepts in the System of National Accounts such as firms and sectors. This approach would also prioritize alignment with existing domestic and international frameworks, such as the Organisation for Economic Co-operation and Development’s (OECD) influential work on measuring well-being, inclusion and sustainability and work led by the UN Economic Commission for Europe (UNECE)—in which Canada is also participating in pursuit of common international definitions of specific well-being measure
Meanwhile, the UN Network of Economic Statisticians, which was recently formed following a similar FOC exercise related to economic statistics, has recommended an approach to international measurement standards beyond GDP that is very similar to Canada's Quality of Life Framework. It will be further developed in the coming year through an interdisciplinary expert group, the Expert Group on Well-being Measurement.
Framework Alignment
Canada's Quality of Life Framework was developed as an umbrella framework, encompassing high-level measures included within other frameworks used across the Government of Canada to measure societal, environmental and economic progress. To keep the Quality of Life Framework relevant, the Program prioritizes alignment with other national and international frameworks, including the Canadian Indicators Framework, the Sustainable Development Goals, the Gender Results Framework, the Federal Sustainable Development Strategy and the Canadian Environmental Sustainability Indicators, among others. Departments have worked together to ensure congruence between frameworks at the indicator level, even though these frameworks are used in different processes and with different stakeholders. For example, Goal 1 of the Sustainable Development Goals is "No Poverty" and Canada's official measure of poverty, the Market Basket Measure, is used throughout each of the relevant frameworks, including the Quality of Life Framework.
In 2024, Statistics Canada assessed the extent to which indicators in other frameworks are also included within Canada's Quality of Life Framework. There continues to be close conceptual alignment between this family of related strategies, and work will continue to ensure that alignment remains a priority.
Use of Quality of Life Indicators
Use of quality of life indicators in prescribed policy applications, like budgeting and departmental reporting, can reveal the relevance of the indicators. Heavily cited indicators suggest areas of high policy relevance, and by extension, priorities for the Quality of Life Statistics Program. The sections below provide summaries of the most frequently cited quality of life indicators in common policy applications.
Budgeting
Since Budget 2021, the Budget Impacts Report provided as an annex to the federal budget has continued to provide a publicly reported assessment of the expected impacts of new spending on the quality of life of people living in Canada, based on the indicators in the Framework. Below are some insights concerning the 2024 Budget Impacts report:
- The Prosperity domain was the most frequently tagged.
- Indicators frequently tagged in the Health domain included Self-rated mental health, Self-rated health, Health-adjusted life expectancy, Timely access to primary care provider, and Unmet health care needs.
- Frequently tagged Society indicators included Sense of pride/belonging to Canada, Positive perceptions of diversity, Sense of belonging to local community, and Participation in cultural or religious practices, recreation or sport.
- Confidence in institutions, Discrimination or unfair treatment, Indigenous self-determination and Misinformation/trust in media were all frequently tagged in the Good Governance domain.
- Frequently tagged Environment domain indicators included Natural disasters and emergencies, Climate change adaptation, Greenhouse gas emissions, Drinking water, and Air quality.
This suggests that these areas are particularly relevant in terms of current policy focus.
Departmental Planning
When reviewing 2024/2025 departmental plans, the Good Governance and Prosperity domains were tagged the most. Environment and Society followed, with Health last. When reviewing the indicators themselves, Confidence in institutions was tagged most frequently, followed by Access to fair and equal justice (civil and criminal), Greenhouse gas emissions, Indigenous self-determination, and Employment to round out the top five most tagged indicators.
Figure 5: Pie chart depicting selection of Quality of Life domains in 2024/2025 Federal Government Departmental Plans
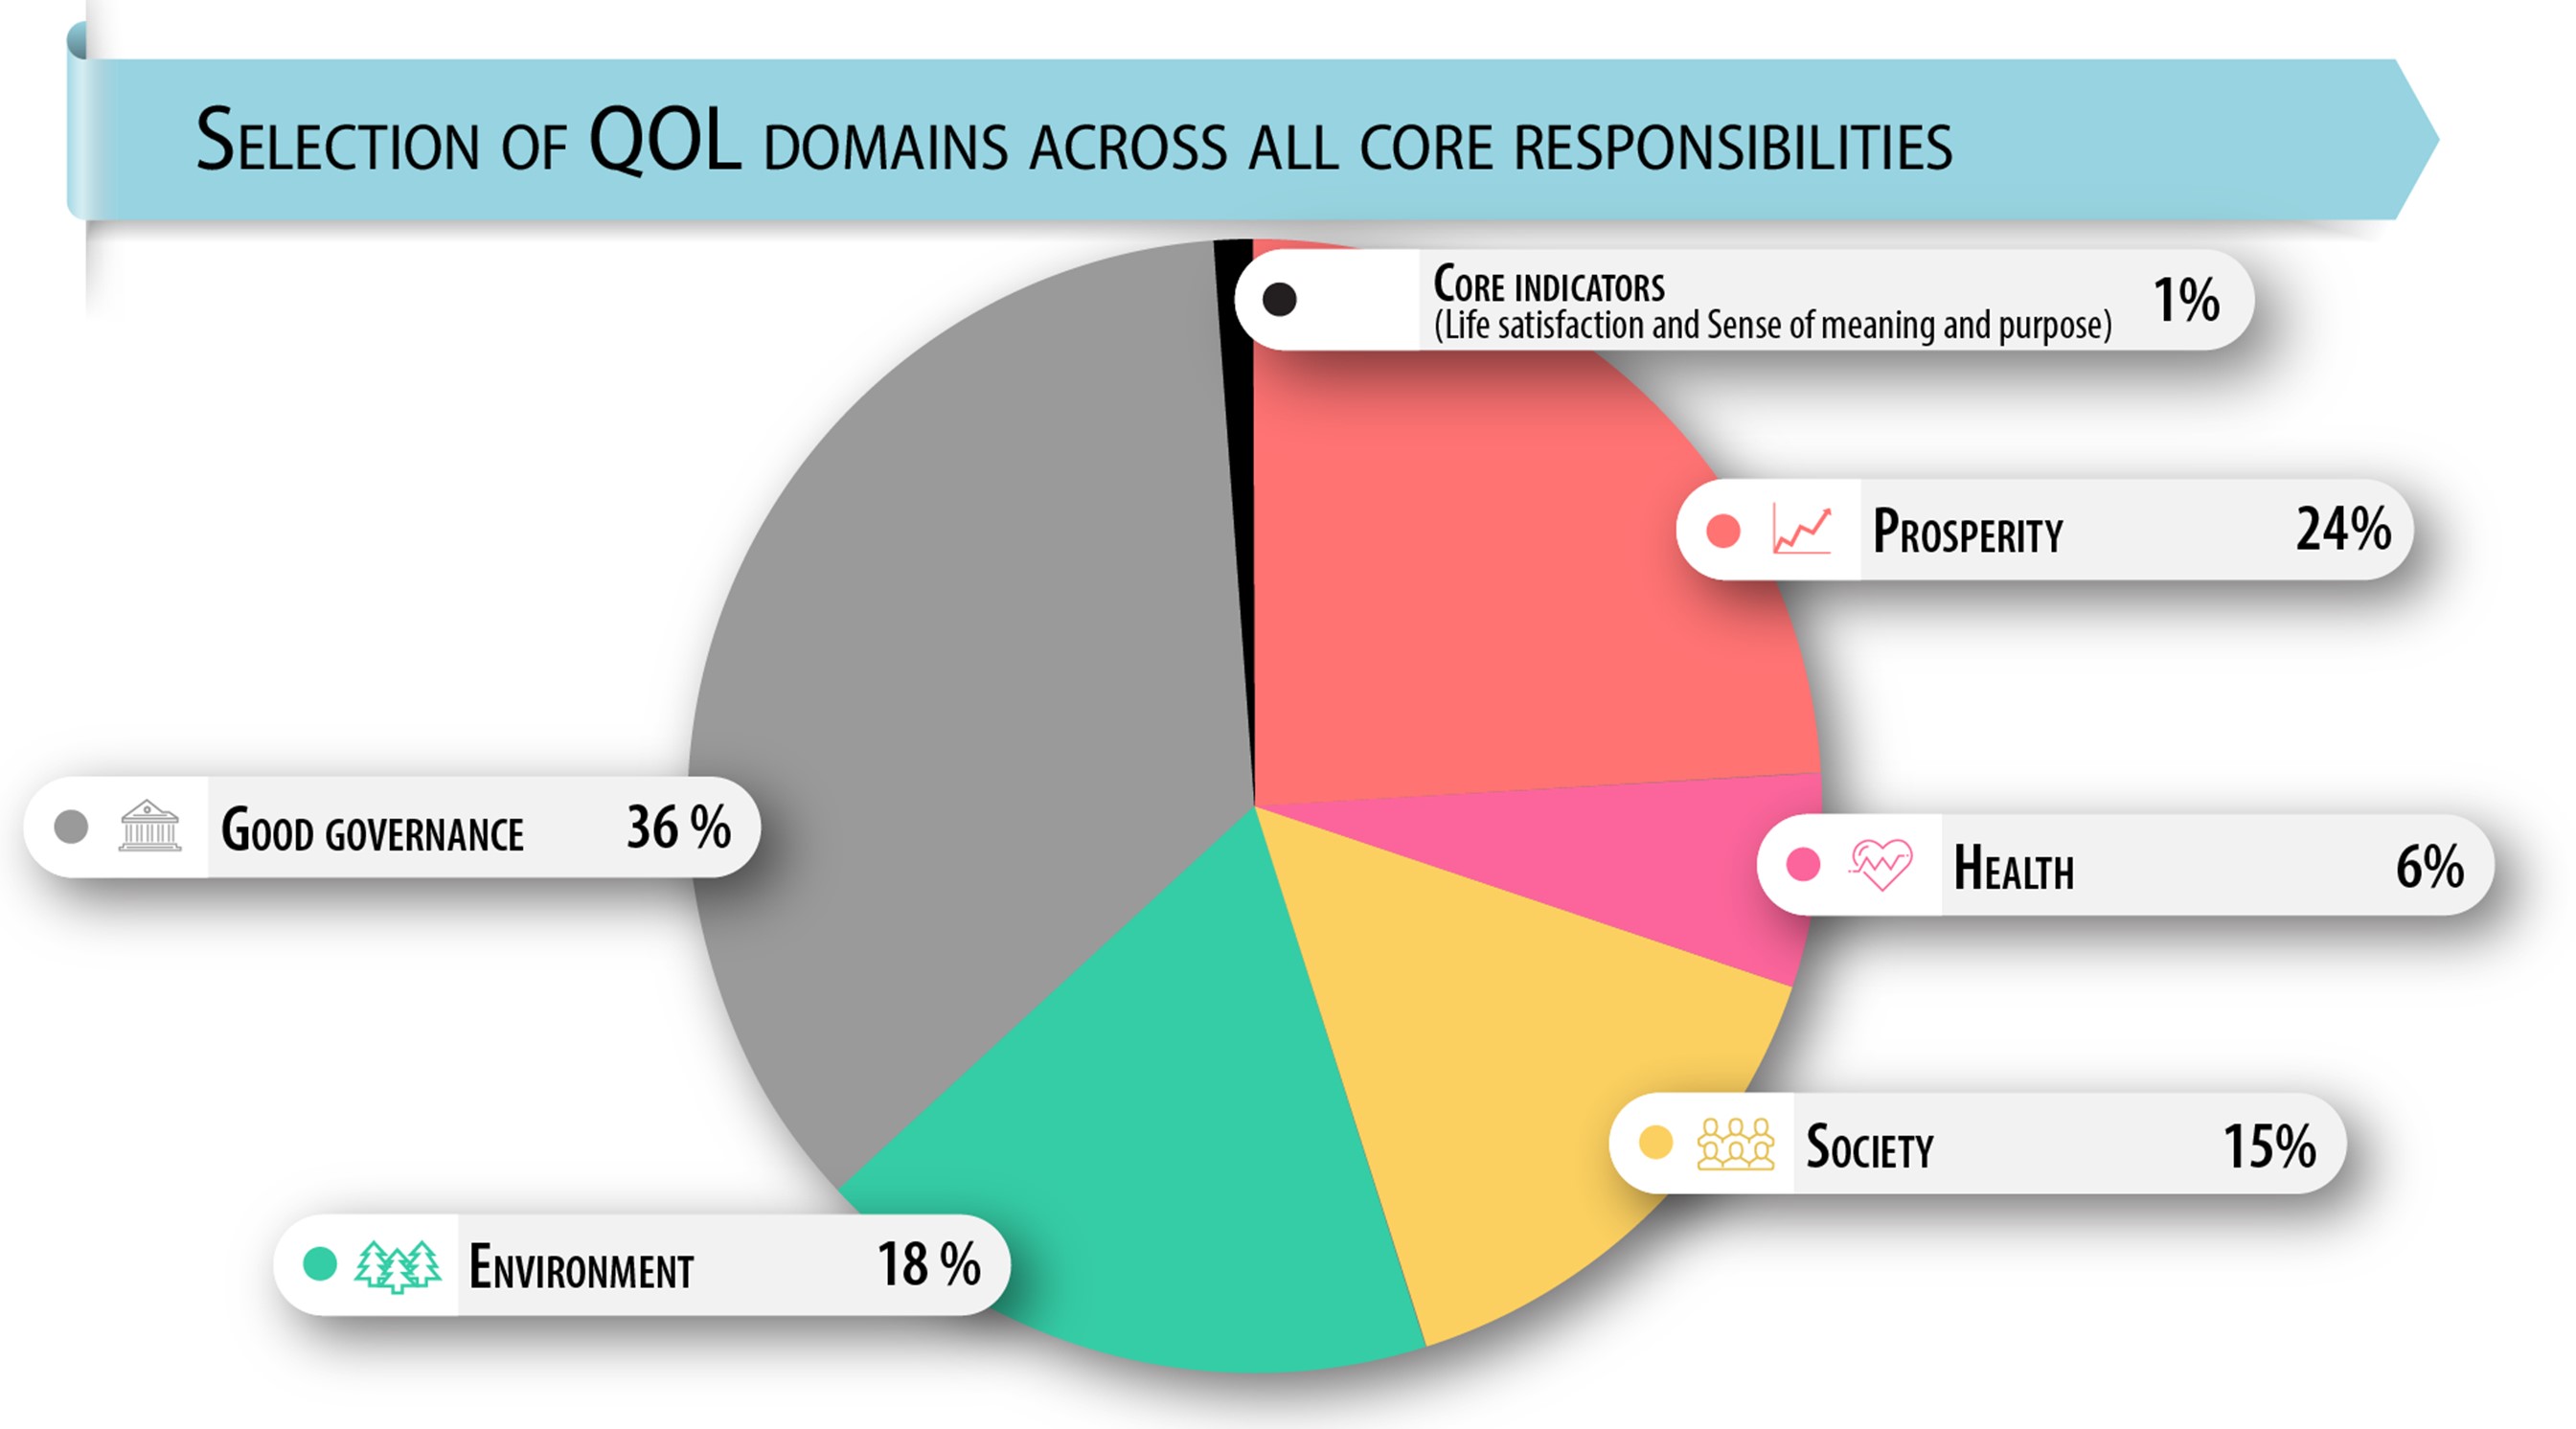
Description - Figure 5: Pie chart depicting selection of Quality of Life domains in 2024/2025 Federal Government Departmental Plans
The title of this image is "Selection of QOL domains across all core responsibilities."
This pie chart shows the percentage of Quality of Life indicators by domain as used in 2024/2025 Federal Government Departmental Plans. The circular graphic is divided into six segments, which represent each of the five domains of the Framework plus the core indicators of Life satisfaction and Sense of meaning and purpose. Each domain is represented by an icon: the Prosperity domain by an image of a line graph, Health by a heart and heartbeat (electrocardiogram) line, Society by a group of people, Environment by a group of trees and Good Governance by a courthouse. Data for the chart shows core indicators at 1%, Prosperity at 24%, Health at 6%, Society at 15%, Environment at 18%, and Good Governance at 36%.
Source: Treasury Board Secretariat
Performance of the Quality of Life Hub
Since the Quality of Life Hub (the "Hub") launched in March 2022, the site has experienced exponential growth and engagement. This is demonstrated by a six-fold increase in page views and upwards of ten-fold increase in page visits in the monthly visits (see Table 1).
| April 2022 | March 2024 | Full Two Years (April 2022 to March 2024) | |
|---|---|---|---|
| ViewsFootnote 4 | 3,774 | 22,959 | 254,190 |
| VisitsFootnote 5 | 1,152 | 12,998 | 112,802 |
Splitting out government and general public engagement, visits from users within the government hit their highest point in October and November 2023 (average 6,500 views and 1,715 visits). Visits from users in the general public rose in November 2023 and sustained their high level into Q1 of 2024. As of March 2024, public engagement accounts for about 90% of visits to the Hub. Consistently since inception, an average of 48% of visits to the Hub involve viewing only one Hub page (i.e., just the landing page, or just one indicator page), while around 30% involve viewing 4 or more hub pages during the visit. The Quality of Life Hub has more engagement than other Statistics Canada hubs.
Chart 2: Hub traffic growth from April 2022 to March 2024
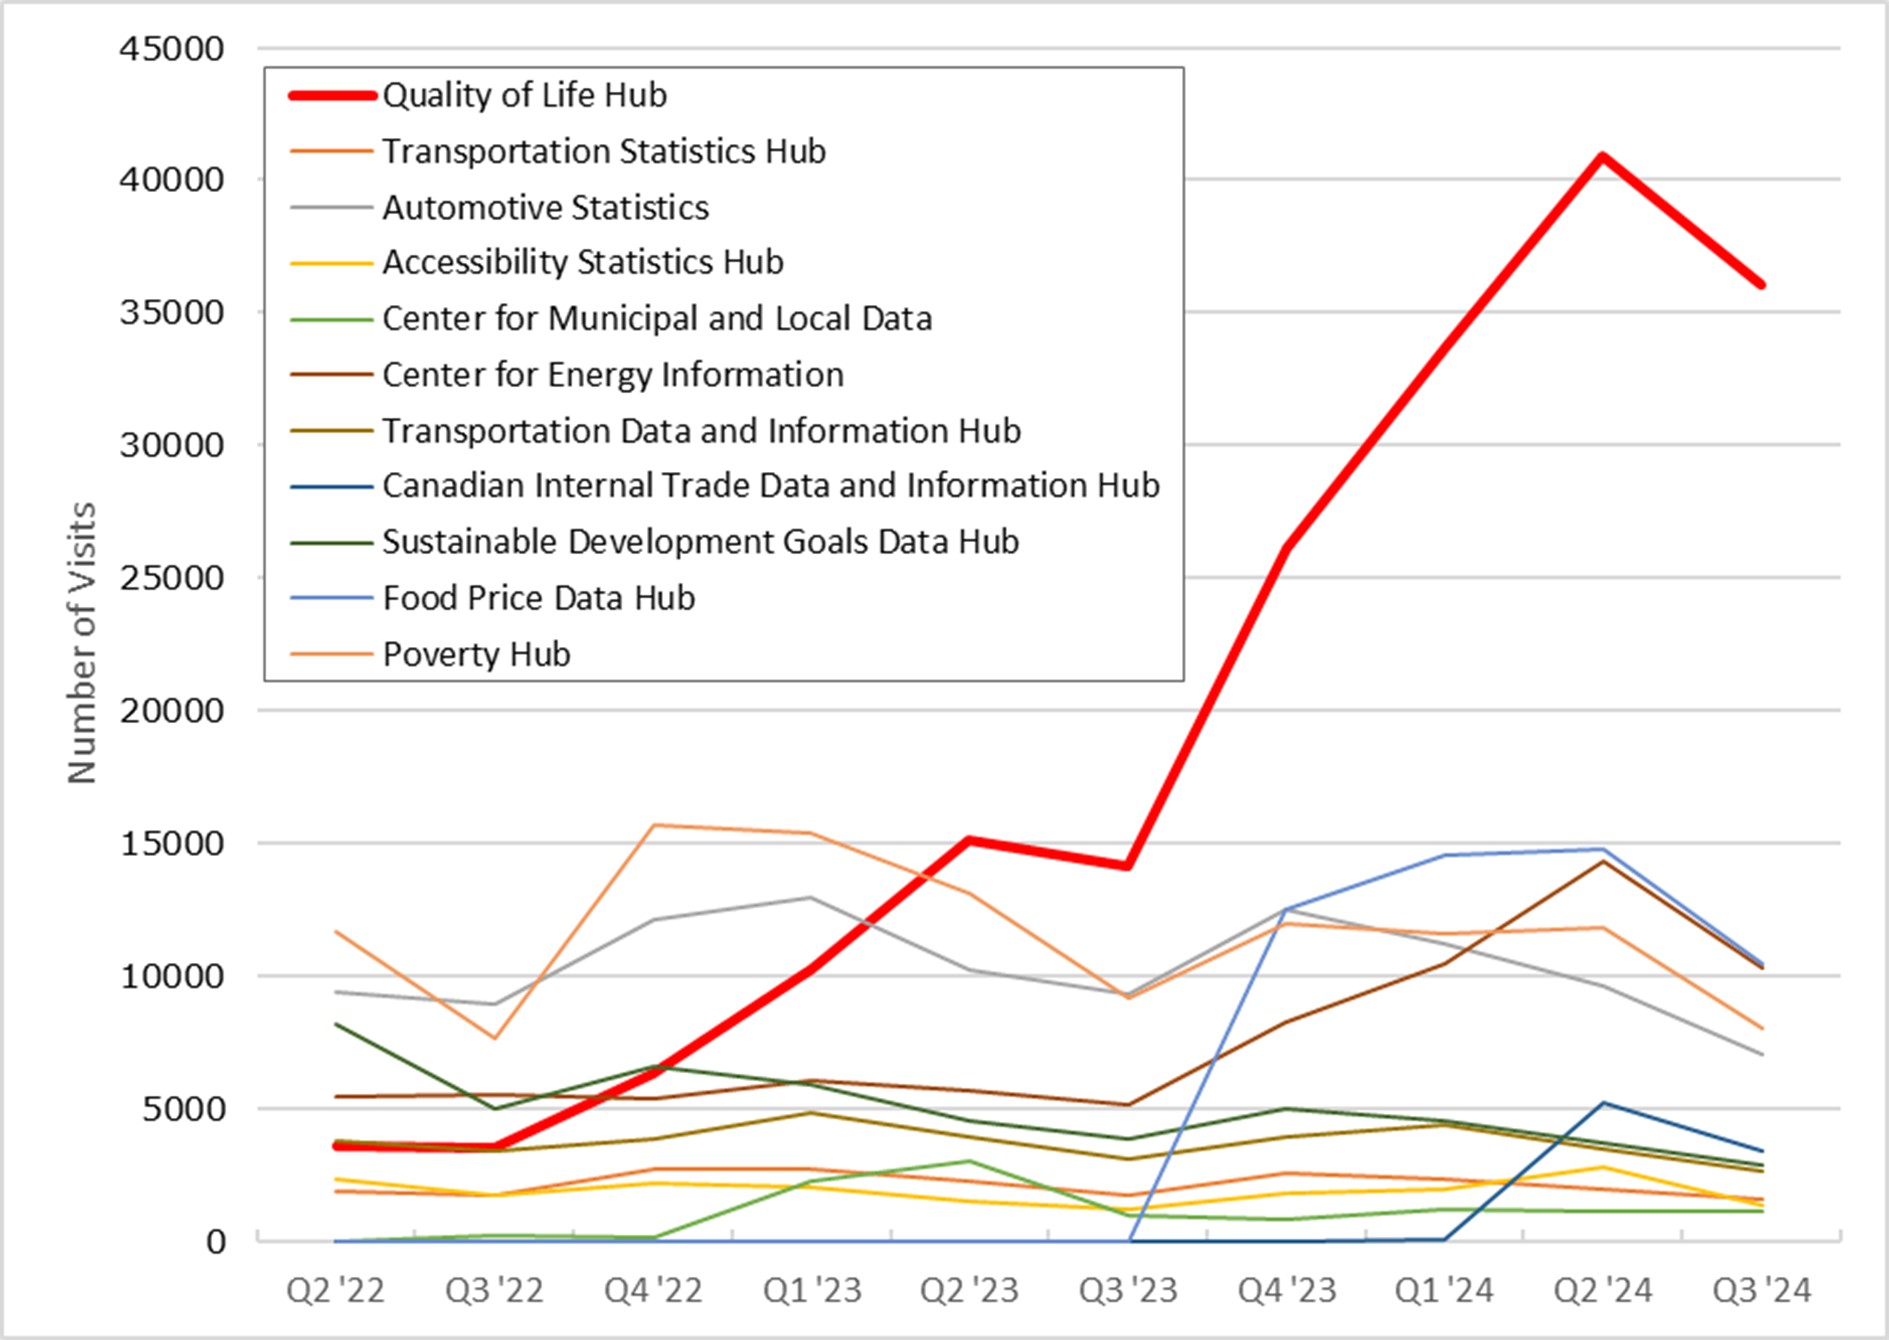
Description - Chart 2: Hub traffic growth from April 2022 to March 2024
| Quarter | Quality of Life Hub | Transportation Statistics Hub | Automotive Statistics | Accessibility Statistics Hub | Center for Municipal and Local Data | Center for Energy Information | Transportation Data and Information Hub | Canadian Internal Trade Data and Information Hub | Sustainable Development Goals Data Hub | Food Price Data Hub | Poverty Hub |
|---|---|---|---|---|---|---|---|---|---|---|---|
| Q2 '22 | 3607 | 1866 | 9373 | 2326 | 0 | 5463 | 3782 | 0 | 8152 | 0 | 11689 |
| Q3 '22 | 3545 | 1700 | 8969 | 1718 | 207 | 5530 | 3420 | 0 | 4994 | 0 | 7620 |
| Q4 '22 | 6311 | 2682 | 12130 | 2190 | 166 | 5387 | 3832 | 0 | 6597 | 0 | 15722 |
| Q1 '23 | 10260 | 2726 | 12988 | 2023 | 2298 | 6037 | 4856 | 0 | 5886 | 0 | 15372 |
| Q2 '23 | 15135 | 2272 | 10238 | 1529 | 2984 | 5708 | 3916 | 0 | 4555 | 0 | 13118 |
| Q3 '23 | 14129 | 1746 | 9307 | 1211 | 966 | 5169 | 3120 | 0 | 3836 | 0 | 9170 |
| Q4 '23 | 26144 | 2535 | 12528 | 1791 | 800 | 8283 | 3949 | 0 | 4987 | 12479 | 11991 |
| Q1 '24 | 33671 | 2306 | 11194 | 1937 | 1170 | 10420 | 4383 | 63 | 4571 | 14580 | 11590 |
| Q2 '24 | 40926 | 1957 | 9634 | 2828 | 1139 | 14295 | 3506 | 5208 | 3702 | 14765 | 11799 |
| Q3 '24 | 36071 | 1603 | 7007 | 1344 | 1089 | 10293 | 2660 | 3364 | 2878 | 10459 | 8052 |
Distribution of Web Traffic in Canada
Canadian regions accounted for a significant portion of Hub traffic, with a total of 90,956 visits (80.6% of total visits around the world). Within Canada, Ontario accounted for 55.6% of the total visits, and specifically the national capital region (NCR), Ottawa and Gatineau, accounted for 24.5% of total Canadian visits, followed by Toronto (12.1% of Canadian visits), Montreal (5.1% of Canadian visits), and Calgary (3.5% of Canadian visits). In the NCR, 78.6% of visits were from government employees, while the rest of the country, 2.9% of visits were from government employees. Clearly, the NCR drives the federal public service's engagement (89% of the total federal public service engagement), but public service engagement only accounts for around 21% of overall visits to the site.
Global Web Traffic
Overall, 80.6% of visits come from within Canada, but the Quality of Life Hub is also attracting attention outside of Canada's borders. The United States (15.6% of international visits), France (12.6% of international visits), and Senegal (10% of international visits) combine for almost 40% of all international visits. Internationally, 25.3% of page views were to the Hub main page. Another 23.5% of views were for the gross domestic product (GDP) per capita page (largely driven by France and Senegal).
Interdepartmental Web Traffic Data
Given the intent of the Quality of Life Hub as a user interface for departmental partners in providing evidence to decision-makers, it is useful to understand how federal departments use the data to ensure they serve their intended purpose. There were some changes in departments who most frequently used the Hub, as shown in the table below.
| Interdepartmental Web Traffic Data for Quality of Life Hub | |||||
|---|---|---|---|---|---|
| Fiscal Year 2022/2023 | Fiscal year 2023/2024 | ||||
| Department | Visitors | Visits per Visitor | Department | Visitors | Visits per Visitor |
| Statistics Canada | 290 | 3.9 | Employment and Social Development Canada | 638 | 2.3 |
| Employment and Social Development Canada | 229 | 1.9 | Health Canada | 531 | 2.6 |
| Health Canada | 225 | 2.2 | Treasury Board Secretariat | 392 | 4.3 |
| Treasury Board Secretariat | 219 | 4.6 | Public Services and Procurement Canada | 340 | 1.9 |
| Department of Finance Canada | 104 | 3.6 | Indigenous Services Canada | 290 | 2.0 |
| All Government Departments | 2,187 | 2.6 | All Government Departments | 5,503 | 2.4 |
Indicator Page Traffic
In total, 108,276 indicator pages were viewed during the two fiscal years (42.5% of total page views; for reference, the Hub landing page represents about 22.7% of total views). For most of FY 2022/2023, the most popular indicators were Life satisfaction, Household income, Sense of belonging to community and Employment. From Q3 in FY 2022/2023, Youth not in employment, education or training (NEET) was among the three most popular, and from Q4 in FY2022/2023, Gross domestic product (GDP) per capita (French page) was among them.
Gathering Data User and Data Producer Perspectives on the Quality of Life Indicators
Method
A key part of the biennial review was to solicit the perspectives of federal data users as a primary audience, along with those of data producers. This was a largely qualitative undertaking with a goal of improving the relevance of the program's outputs with their intended policy uses. It had two broad components:
- An external component, soliciting feedback from central agencies and departments who use quality of life data in budgeting and decision-making. This took place in spring 2024, when departments and agencies were asked to provide written feedback via an informal survey on the definition of quality of life indicators, frequency of collection, and granularity of available quality of life data through the QOL interdepartmental governance mechanism. This effort was complemented with a series of four semi-structured focus groups with select departments and agencies. In total, 35 departments provided feedback.
- An internal (in-Agency) component leveraging a series of efforts to improve the timeliness and granularity of quality of life data over the past two years, and a process to solicit feedback from the producers of quality of life data. The latter took place in the summer of 2024. Overall, this component sought to document Statistics Canada's expert advice as a national statistical office on the conceptual clarity, timeliness and granularity of the data it produces in support of the Quality of Life Framework.
In addition, all departments and agencies were invited to provide comments via the feedback page on the QOL Hub. This mechanism was also specifically promoted to the interdepartmental results community, via TBS's results newsletter and presentations to the Heads of Performance Measurement and Evaluation.
Finally, TBS shared with Statistics Canada its initial observations of working with departments and agencies to integrate QOL indicators and considerations into Treasury Board submissions, as well as its observations of the integration of QOL indicators in the 2024/2025 Departmental Plans.
What We Heard: Feedback from Federal Data Users
The majority of indicators in the Framework are being used on a regular basis by data users in their advice to decision-makers, including through the federal budget and results reporting processes. While some indicators are used less frequently, they still provide valuable insight into the quality of life of Canadians, especially when evaluated alongside or against other measures. There were some suggested changes or updates noted for indicator definitions. In terms of the timeliness of data, annual frequencies were most commonly preferred as a minimum frequency (or aggregation of more frequent intervals) to best support annual monitoring and reporting processes.
In general, data needs are being met; however, the need for improved geographic disaggregation emerged as a top theme from data users. Regionally disaggregated data are considered important across federal government departments and agencies. Users also frequently requested additional data breakdowns by various equity, diversity and inclusivity factors such as sex, gender, rural/urban areas and Indigenous status. They brought up the need for disaggregation by employment type several times throughout the focus groups to analyze quality of life for specific industries like agricultural workers or medical practitioners. Findings about domain-specific gaps are indicated in the sections below.
Departmental input—whether collected through the focus groups or through the survey—tended to focus on the department's policy mandates and generally did not extend to other domains or indicators that were not directly tied to those mandates. This suggests that further capacity-building would be useful in promoting the holistic nature of quality of life and the relationship among indicators across domains, something that is evident when assessing their impact on Canadians' well-being.
Central Indicators
Relevancy
The use of Life satisfaction appears to slightly outweigh Sense of meaning and purpose, as there are more instances of departments relaying the high relevance of Life satisfaction.
Data needs
Most departments suggested annual collection for the central indicators, given their needs for annual reporting cycles such as budget development and results reporting. Data users requested breakdowns by various socio-demographic characteristics including gender, age and ethnicity and more data at sub-provincial levels.
What gaps remain?
No comments were received from data users on the definition for Life satisfaction. Some comments indicated that the definition for Sense of meaning and purpose may be too broad for specific program outcomes. This is consistent with their function as broad-based underlying measures for the framework as a whole, as opposed to being outcomes that are necessarily influenced by specific government investments.
Prosperity
Relevancy
Prosperity indicators are widely used for research, analysis and policy development. Feedback from the data user survey noted that every Prosperity indicator received at least one "frequently" used mention from departments. In 2024/2025 departmental plans, Prosperity indicators were the second most frequently used in the Framework, tagged a total of 118 times out of 475. The most frequently used indicators in the domain include Employment, GDP per capita and Financial well-being. Notably, several Prosperity indicators (e.g., monthly labour market and quarterly economic indicators) also tend to be collected on a more frequent, timely and predictable basis than many social and environmental indicators, which influences their utility in policy and decision-making processes.
Data needs
Users cited annual data as the most often needed. They also often requested finer levels of disaggregation across all indicators for gender differences intersecting with other select demographic characteristics, including Indigenous identity, immigrant status and racialized group. While users requested more data at sub-provincial levels, they may not be aware that some of these additional breakdowns exist for select indicators but are not currently disseminated, and they are available through custom data requests.
What gaps remain?
A few Prosperity indicator definitions remain in development, including Homelessness, Child, student and adult skills and Precarious work. While measuring Homelessness will be a challenge, there are existing definitions that can potentially be leveraged. For example, the recently updated Canadian Indicator Framework for the Sustainable Development Goals (SDGs) is using an indicator of Shelter users experiencing chronic homelessness. A dedicated team at Statistics Canada focused on measuring homelessness is providing support to define this indicator.
Some data users requested context around the inclusion of indicators in the Framework, including how they contribute to overall well-being. Indicators could benefit from the creation of a "Why this indicator matters" section on the Hub, to clearly link the purpose of the indicator with the intended outcome.
Health
Relevancy
Health indicators are used in the socio-demographic analysis of different population groups across Canada and are relevant when studying service access issues. Many Health indicators have useful applications, including research and analysis for policy development in relation to mental health, evaluation of employment and social programs, the study of service accessibility issues, and understanding the health of the immigrant population. The most frequently cited indicators in 2024/2025 departmental plans included Self-rated mental health, Health-adjusted life expectancy (HALE) and Self-rated health.
Data needs
In most cases, users noted annual data is sufficient for policy needs and reporting. Data users are increasingly interested in more granular levels of disaggregation, including cultural or racial background, immigrant status, first official language, distinctions-based Indigenous identity, 2SLGBTQI+ identity, employment status, employment type, educational attainment, income, sex, gender and age. Many of the existing geographic breakdowns were sufficient for users, but data for the territories is needed for select indicators. Some users would like to have data at the neighbourhood level, but sample sizes limit the levels of disaggregation that can be obtained.
Data producers noted that data on some population groups, such as children and youth ages 1 to 17, Indigenous peoples and persons with disabilities are available for a number of Health indicators but not currently reported in tables. Disability status is increasingly important to report on, considering that 27% of Canadians aged 15 and older have a disability, a number that increases to 40% for those over the age of 65.
What gaps remain?
While the set of Health indicators at the national level are useful for determining broad trends that can be explored for identifying policy priorities, it is challenging to apply or interpret indicators at a departmental or, even further, at a program level, given differences in scale and attribution. Future work could include indicators related to caregiver burden, as it has a significant impact on quality of life. Health indicators that are currently in development include Children vulnerable in early development, Long-term care (access and quality) and Healthy eating environments.
Collection for the majority of Health indicators will move onto the Canadian Community Health Survey (CCHS). Statistics Canada is working toward increasing dissemination frequency of indicators collected in the CCHS to a biannual cadence, to support more timely data for quality of life measures.
Society
Relevancy
Data users reported using Society indicators for a diverse range of purposes. They are used in the socio-demographic analysis of regional populations, where an understanding of people can be reflected in investment in community infrastructure. Society indicators help to measure the integration of newcomers to Canada, including participation in social or cultural activities, recreation and sports. The Society domain was tagged a total of 71 times in 2024/2025 departmental plans, with Positive perceptions of diversity tagged most frequently, followed by Sense of pride/belonging to Canada and Sense of belonging to local community.
Data needs
Some departments indicated that working with data releases every five years is acceptable, but ideally indicators would be collected and disseminated annually. Users requested disaggregation for as many groups as possible and continued to emphasize gaps in geographic breakdowns, specifically at the provincial and sub-provincial levels.
What gaps remain?
Some data users noted that Society indicators tend to focus on individual subjective measures and less on the factors that influence or foster community inclusion. Additional indicators such as access to community organizations or local events or proximity to schools may be worth including, as they reflect a healthy or supportive community that contributes to residents' quality of life. Users noted it may be beneficial to create a healthy community indicator to reflect federal investments at the community level and in programs to strengthen the social finance and social purpose sector. Some users noted a lack of clarity in how to access data on indicators, so there is an opportunity to provide improved tools or simplified instruction detailing how to find and manipulate data tables on the Hub.
Good Governance
Relevancy of indicators
Confidence in institutions and the spread of misinformation are highlighted by data users as top policy concerns, with the increase of cyberattacks and online harm and the historical infrequency of data collection related to Confidence in institutions, as well as data gaps with respect to mis- and disinformation. Misinformation was noted as being of critical importance given potential consequences for public health, as seen during and following the recent COVID-19 pandemic. Good Governance domain indicators were by far the most frequently used in 2024/2025 departmental plans, tagged 169 times out of 475, representing over one-third of tags.
The most-used indicator, not just within Good Governance but across all domains was Confidence in Institutions, tagged 67 times in departmental plans and often used to examine issues related to trust. While there is genuine policy focus in this area, it should be noted that these high levels of usage also reflect a tendency from a process perspective to use this indicator (e.g., in budget proposals) to capture spending activity that occurs within government and has less direct impact on other aspects of quality of life. Other commonly used indicators in this domain include Access to fair and equal justice (civil and criminal), Indigenous self-determination, Discrimination or unfair treatment and Personal safety.
Data needs
Echoing feedback received for other domains, data users noted that annual data was most often needed. Finer levels of disaggregation were requested across all indicators for gender differences intersecting with demographic characteristics such as Indigenous identity, immigrant status and racialized groups. Data users requested greater levels of geographic disaggregation at sub-provincial levels.
Data producers noted there are avenues to explore for possible data collection through administrative sources for select indicators.
What gaps remain?
Two indicator definitions remain under development—Canada's place in the world and Indigenous self-determination. User feedback suggested expanding the scope of measures for the Cyberbullying indicator to capture various forms of online harassment and to include measures of intervention effectiveness. In general, there are areas to enhance the relevance of the Framework for the public safety/security, and global affairs policy portfolios.
Environment
Relevancy of indicators
Environmental indicators are being used to support thematic alignment links to policy goals and for programming by regional development agencies. Climate change adaptation is used as a measure of local capacity to understand climate risk. As the number of wildfires, floods and other natural hazards increase and populations become displaced either temporarily or permanently, the importance of climate change adaptation strategies will continue to rise. Environment indicators were cited in 2024/2025 departmental plans 83 times. Some of the most frequently used indicators include Greenhouse gas emissions, Climate change adaptation, Natural disasters and emergencies, Waste management and Air quality.
Data needs
In line with planning cycles, annual data was cited as most often needed by users. Common themes emerged including the need for more levels of disaggregation by cultural or racial background, immigrant status, first official language, distinctions-based Indigenous identity and 2SLGBTQI+. Some organizations reported they are under increased pressure to speak to climate change and are seeking enhanced disaggregation of population groups such as children (0-18) to build stronger socioeconomic resilience. There were several requests for smaller geographic levels of disaggregation for indicators at the national, regional, down to the neighbourhood level.
What gaps remain?
Natural capital is close to completion and will align with the Census of Environment principles to build understanding of the extent, condition and benefits of Canadian ecosystems. Climate change adaptation was flagged as difficult to use as currently defined. To strengthen this indicator, users suggested it would be beneficial to add measures that reflect a particular aspect of adaptation or resilience that would apply to a wider group.
What We Heard: Feedback from Data Producers
As a horizontal effort, the Quality of Life Statistics Program draws upon a wide range of data sources. As a critical part of the review, the producers of quality of life statistics were asked to provide feedback on the indicators that fall within their areas of responsibility, with a view to improving conceptual clarity and ensuring that the Program continues to produce and disseminate data in ways that are most relevant to the overall objective of measuring quality of life for people living in Canada in a multidimensional way. This phase of internal consultations yielded the following suggested changes to select quality of life indicators.
Overall, data producers felt that the current indicator names, definitions and measurements continued to be relevant, though minor adjustments to some names and definitions were suggested, which are outlined in the section below. Alongside more detailed feedback on the definitions and measurement, indicator leads at Statistics Canada were asked to confirm the primary sources for indicators and provide a recommended collection frequency.
Updates to Headline Indicators
To ensure timely reporting of an overall snapshot of the well-being of Canadians, the following updates were proposed to adjust the set of headline indicators. Headline indicators will be used for more frequent monitoring, often quarterly or biannually and are supported by other indicators that may be collected less frequently.
With these changes, the Quality of Life Framework would feature 23 headline indicators moving forward.
| Indicator | Proposed change | Rationale |
|---|---|---|
| Future outlook | Elevate to headline indicator status and group with Life satisfaction and Sense of meaning and purpose |
|
| Financial well-being (Making ends meet) | Elevate to headline indicator status | |
| Self-rated health (Perceived health) | Elevate to headline indicator status | |
| Health-adjusted life expectancy | Remove from headline indicator status | |
| Trust in others | Elevate to headline indicator status | |
| Time use | Remove from headline indicator status | |
| Satisfaction with time use | Elevate to headline indicator status | |
| Neighbourhood safety after dark | Elevate to headline indicator status | |
| Personal safety (Victimization) | Remove from headline indicator status | |
| Climate change adaptation | Remove from headline indicator status |
Updates to Indicator Names
The following indicator name changes were proposed by data producers and subject matter experts to better reflect definitions and improve clarity.
| Current indicator name | Proposed new indicator name | Rationale |
|---|---|---|
| Child, student and adult skills | Child skills Adolescent skills Adult skills |
Reflects that students can be any age, avoids overlap between categories. Split into three separate indicators as they are three different concepts |
| Access to early learning and child care | Early learning and child care | Broadens the scope |
| Precarious or gig work | Job security and gig work | Better captures the underlying concept as recommended by subject matter experts |
| Food security | Food insecurity | Aligns with standard reporting terminology |
| Financial well-being | Making ends meet | Consistent with international standards and clearer definition |
| Firm growth | Firm dynamism | Better represents the concept measured. Firm growth implies that individual firms are growing; dynamism speaks more to the growth of a sector (entry/exit). |
| Housing Needs | Core housing need Acceptable housing |
Split into two indicators as they measure two separate concepts |
| Public net financial liabilities-to-gross domestic product (GDP) | General government net financial liabilities-to-gross domestic product (GDP) | Better represents the concept measured. |
| Fruit and vegetable consumption/healthy eating environments | Fruit and vegetable consumption Healthy eating environments |
Split into two indicators as they measure two separate concepts |
| Unmet health care needs | Unmet needs for health care | Aligns with format of other "unmet needs" indicators |
| Self-rated health | Perceived health | To align with Health Statistics Branch indicator definitions. |
| Self-rated mental health | Perceived mental health | To align with Health Statistics Branch indicator definitions. |
| Sense of pride/belonging to Canada | Sense of pride in Canada Sense of belonging to Canada | Splits into two indicators for better specificity |
| Satisfaction with personal relationships (family and friends) | Satisfaction with personal relationships | Simplify the concept |
| Positive perceptions of diversity | Shared values | Aligns better with the measurement – values rather than diversity |
| Personal safety | Victimization | More accurately captures the concept and is widely recognized |
| Misinformation/trust in media | Misinformation Trust in media |
Splits into two indicators, as they measure two different concepts |
| Access to fair and equal justice (civil and criminal) | Confidence in access to fair and equal justice (civil) Confidence in access to fair and equal justice (criminal) |
Better captures the measurements used for this indicator (subjective rather than objective measures) Split into two indicators, as they measure different concepts (civil and criminal) |
| Walkable communities | Active living environments | Broadens the scope of the indicator to include other active modes of transportation |
Updates to Indicator Definitions or Measurement
The following updates were proposed by data producers and subject matter experts to improve conceptual clarity and enhance measurement precision.
| Indicator | Current definition | New proposed definition or measurement | Rationale |
|---|---|---|---|
| Gross domestic product (GDP) per capita | Gross domestic product (GDP) per capita | Add real GDP per capita and GDP per capita on a quarterly basis | Real GDP per capita is a key measure of recovery from recession and economic health. |
| Household wealth | Net worth of economic families and persons not in economic families. | Add Operational reporting section to Hub page: Median net worth among economic families and persons not in an economic family |
Medians are less affected by outliers |
| Job satisfaction | Proportion of the population by level of job satisfaction | Proportion of the employed population by level of job satisfaction | Update to proportion of employed population |
| Self-rated mental health (Perceived mental health) | Proportion of the population by perceived mental health status. | Add Operational reporting section to Hub page: Proportion of the population reporting excellent or very good mental health |
To align with Health Statistics Branch indicator definitions. |
| Self-rated health (Perceived health) | Proportion of the population by perceived health. | Add Operational reporting section to Hub page: Proportion of the population reporting excellent or very good health |
To align with Health Statistics Branch indicator definitions. |
| Functional health status | Proportion of the population by overall functional health, based on 8 dimensions of functioning (vision, hearing, speech, mobility, dexterity, feelings, cognition and pain). | Add Operational reporting section to Hub page: Response categories TBD |
To align with Health Statistics Branch indicator definitions. |
| Fruit and vegetable consumption (Fruit and vegetable consumption and Healthy eating environments) | Proportion of the population reporting consumption of fruit and vegetables in a specified time period. | Add Operational reporting section to Hub page: Proportion of the population who report eating fruits and vegetables five or more times per day |
To align with Health Statistics Branch indicator definitions. |
| Timely access to primary care provider | Both indicators ask about the most recent consultation with a primary care provider in the past 12 months: Wait time (in days or months) between requesting care for a non-urgent need and speaking with a primary health care provider. (Objective measure) Satisfaction with wait time between requesting care for a non-urgent need and speaking with a primary health care provider. (Subjective measure) |
Add Operational reporting section to Hub page: Proportion of the population who reported being able to consult a health provider when they were sick or concerned (same day or next day) Proportion of the population who were satisfied or very satisfied with the wait time to access a health provider when they were sick or concerned |
To align with Health Statistics Branch indicator definitions. |
| Unmet health care needs | Proportion of the population reporting unmet healthcare needs (other than for home care). | Proportion of population reporting unmet healthcare needs | Definition change to remove "(other than for homecare)" from definition when switching source to SHCAE in 2025, directly aligns with question wording |
| Sense of pride/belonging to Canada | Proportion of the Canadian-born population by level of pride in being Canadian. Proportion of the immigrant population by level of pride in living in Canada. Proportion of the population by strength of sense of belonging to Canada. |
Proportion of the Canadian citizen population by level of pride in being Canadian | The flow condition was updated based on citizenship rather than place of birth, so the definition needs to be changed as well |
| Indigenous languages | Proportion of the Indigenous population with the ability to speak or understand an Indigenous language. | Number of people who report the ability to speak an Indigenous language well enough to conduct a conversation, by specific Indigenous languages. | The current definition refers to Indigenous languages in the aggregate and thus misses the necessity of disaggregating by specific languages |
| Satisfaction with time use | How satisfied are you with the amount of time you have to do the things that you like doing? | Using a scale of 0 to 10, where 0 means "Very dissatisfied" and 10 means "Very satisfied", how satisfied are you with how you use your time?" | Change in measurement to align with Time Use Survey question, algins directly with current indicator definition |
| Climate change adaptation | Proportion of municipal organizations that factored climate change adaptation into decision-making processes. | Proportion of core public infrastructure owners who factored climate change adaptation into their decision-making process. | The municipality data tables will be updated to include all core public infrastructures, so the definition should be more broad. |
| Walkable communities (Active living environments) | Proportion of the population who live within walking distance to employment, grocery stores, pharmacies, health care, child care, primary education, secondary education, public transit, neighbourhood parks, arts and cultural sites, or libraries. | Change data source to Spatial Access Measures (SAM) | Replaces the Proximity Measures Database and includes additional walking and biking measures |
| Access to public transit | Proportion of the population who can access potential employment within a specified period of time using public transit Proportion of the population who can access amenities (grocery stores, pharmacies, health care, child care, primary education, secondary education, neighbourhood parks, arts and cultural sites, or libraries) within a specified period of time using public transit |
Change data source to Spatial Access Measures (SAM) | Replaces the Proximity Measures Database and includes additional walking and biking measures |
Conclusion and Recommendations
As key outcomes of its first biennial review of the quality of life indicators, Statistics Canada recommends that the Program's governance bodies endorse the following recommendations, to lay the foundation for continued success for the Program in its next phase of implementation.
- Adopt the changes to the headline indicators as proposed above.
- Adopt the changes to indicator names as proposed above.
- Adopt the changes to the definition/measurement of select indicators as proposed above.
- Endorse the high-level work plan for the Quality of Life Statistics Program as described in Appendix A.
Overall, the review finds that the Program has made substantial progress in its first two years of operation. The majority of quality of life indicators are defined, the Hub has been established and there are signs that it is increasingly well-used among the policy community, and there has been meaningful progress in improving the frequency and granularity of quality of life indicators to enhance their relevance for policy use.
In the coming years, the Program's work plan (Appendix A) is designed to build upon the momentum it has already built in the following ways:
- Finalizing definitions for quality of life indicators, with a particular focus on improving the relevance of the Framework for the public safety and global affairs portfolios. Initially, this effort will focus on concepts like Trust in media, Misinformation, and Canada's place in the world.
- Continued modernization of the Quality of Life Hub, to realize its vision as a "one-stop shop" for policy makers seeking integrated data on the quality of life of people living in Canada.
- Building on early efforts to improve the timeliness and granularity (disaggregation) of quality of life data.
- Ongoing analysis and dissemination of insights on the quality of life of people living in Canada.
Scope of the Next Biennial Review (2026)
Finally, having focused this initial biennial review on the needs of federal policy users as a primary audience, the next review, to be tabled in 2026, will focus on the needs of external data users as a key group which creates the social license for the Program. This focus is timely for the Program as it seeks to improve the relevance of the Framework and its indicators for Indigenous-led organizations and communities, academics, other levels of government, and not-for-profits, many of which have coalesced into the growing Canadian Wellbeing Knowledges Network. Detailed plans for this review will be brought forward to the Program's governance committee later in 2025/2026.
Appendices
Appendix A: Work Plan (2024/2025–2025/2026)
| Objective 1: Quality of Life Framework inaugural biennial review | |||
|---|---|---|---|
| Task/milestone | Notes | Key dates | Source of funds |
| Prepare and present biennial review findings and report | Seek endorsement from the interdepartmental committee | December 2024 | Quality of Life Treasury Board Submission funding |
| Disseminate report on the biennial review | Publish report February 25, 2025 | Quality of Life Treasury Board Submission funding | |
| Update Quality of Life Hub with endorsed changes | Work with indicator leads internally to draft updated Hub pages, update other Quality of Life communications products | Publish updated Hub pages in March 2025 | Quality of Life Treasury Board Submission funding |
| Objective 2: Define quality of life indicators, draft and release Hub pages | |||
| Task/milestone | Notes | Key dates | Source of funds |
| Define Child skills, adolescent skills and adult skills | Data sources exist for adolescent and adult skills, defining child skills is more challenging | Define indicator and release Hub page by March 31, 2026 | Quality of Life Treasury Board Submission funding |
| Define Homelessness | The Canadian Indicators Framework has released a definition for homelessness that QOL can potentially align with | Define indicator and release Hub page by March 31, 2026 | Quality of Life Treasury Board Submission funding |
| Define Job security and gig work | Gig work is a sub-indicator under Job security with an endorsed definition, work to define subsequent sub-indicator on job security | Define indicator and release Hub page by March 31, 2026 | Quality of Life Treasury Board Submission funding |
| Define Children vulnerable in early development | Work has been progressing on a definition lead by health subject matter experts | Define indicator and release Hub page by March 31, 2026 | Quality of Life Treasury Board Submission funding |
| Define Long-term care (access and quality) | Work has been progressing on a definition lead by health subject matter experts | Define indicator and release Hub page by March 31, 2026 | Quality of Life Treasury Board Submission funding |
| Define Healthy eating environments | Work has been progressing on a definition lead by health subject matter experts both internal and external to StatsCan | Define indicator and release Hub page by March 31, 2026 | Quality of Life Treasury Board Submission funding |
| Define Natural capital | Definition will be ready for endorsement at the Winter 2026 interdepartmental meeting | Define indicator and release Hub page by March 31, 2026 | Quality of Life Treasury Board Submission funding |
| Define Canada's place in the world | Preliminary discussions on definitions have been held, aim to bring a definition for endorsement at the Winter 2026 interdepartmental meeting | Define indicator and release Hub page by March 31, 2026 | Quality of Life Treasury Board Submission funding |
| Define Indigenous self-determination | While a placeholder QOL Hub page exists, work will progress with partners to define this indicator | To be confirmed | Quality of Life Treasury Board Submission funding |
| Objective 3: Filling gaps for priority policy issues | |||
| Task/milestone | Notes | Key dates | Source of funds |
| Revisit Trust in media definition | While a definition and measurement currently exist, these will both be revisited as part of the next Framework review | 2025/2026 | Quality of Life Treasury Board Submission funding |
| Define Misinformation | While definitions exist for misinformation, data collection is on an ad hoc basis | Define indicator and release Hub page by March 31, 2026 | Quality of Life Treasury Board Submission funding |
| Gap analysis for public safety/security focused indicators | Work with subject matter experts across the federal government to identify gaps with a view to improve the policy relevance of the Framework for this sector | 2025/2026 | Quality of Life Treasury Board Submission funding |
| Objective 4: Enhancing data and filling data gaps for quality of life indicators | |||
| Task/milestone | Notes | Key dates | Source of funds |
| Alternative data project | Focus on 1-2 'test' candidate indicators, seeking alignment with indicators identified in Objectives 2 & 3 above | 2024/2025 Fiscal year | Internal Statistics Canada funding |
| Explore feasibility of developing standards and harmonized content for Quality of Life indicators | Working internally at Statistics Canada to develop dissemination standards and harmonized content for select indicators | Autumn 2024 to Spring 2025 | Internal Statistics Canada funding |
| Objective 5: Disseminating insights on the Quality of Life of Canadians | |||
| Task/milestone | Notes | Key dates | Source of funds |
| Explore geographic disaggregation of Quality of Life indicators | Releases planned for 2025 | Internal Statistics Canada funding | |
| Release on quality of life data for persons with disabilities | Analysis will focus on the Canadian Survey on Disability and the Canadian Social Survey | Anticipated release in Winter 2025 | Disaggregated Data Action Plan (DDAP) funding |
| Analytical releases focused on data investments in the Canadian Social Survey for Quality of Life indicators | Focus of releases are to fill dissemination data gaps, will include the release of data tables for future waves and updates to the data visualization product | Release dates TBD-will vary throughout 2025 and 2026 | Quality of Life Treasury Board Submission funding |
| Objective 6: Develop and implement a targeted engagement and communications plan | |||
| Task/milestone | Notes | Key dates | Source of funds |
| Develop engagement and communications plan | In consultation with communications experts at Statistics Canada, develop strategy | Winter/Spring 2025 | Quality of Life Treasury Board Submission funding |
| Develop plan for engagement with Indigenous partners | Will collaborate with the Centre for Indigenous Statistics and Partnerships at Statistics Canada | Develop throughout 2025/2026 | Quality of Life Treasury Board Submission funding |
| Develop plan for engagement with provinces and territories | Collaborate with provincial and territorial governments on next biennial review | Winter/Spring 2025 | Quality of Life Treasury Board Submission funding |
| Develop plan for engagement with external partners (e.g. Canadian Wellbeing Knowledges Network) | Winter/Spring 2025 | Quality of Life Treasury Board Submission funding | |
| Objective 7: Hub modernization | |||
| Task/milestone | Notes | Key dates | Source of funds |
| Experiment with Statistical Data and Metadata eXchange (SDMX) for Hub enhancement | Experimentation in 2024/2025 may lead to product development in 2024/2025 | 2024/2025 | Internal Statistics Canada funding |
| Landing page updates | Update with main stories in social statistics and interactive embedded widgets for users to filter on population groups as well as international comparisons and Framework alignment | 2025/2026 | Quality of Life Treasury Board Submission funding |
| Domain page updates | Redesign to showcase differences in equity groups and changes to the distribution of the population across various indicators, with a focus on within-country comparisons | 2025/2026 | Quality of Life Treasury Board Submission funding |
| Objective 8: Multilateral engagement | |||
| Task/milestone | Notes | Key dates | Source of funds |
| United Nations Statistical Commission Friends of the Chair Release | Ongoing support to the Friends of the Chair Group as it works toward its recommendations for a System of Social and Demographic Statistics. | Ongoing. The FOC will wrap up its mandate in late 2025/early 2026 |
N/A |
| Objective 9: Advance next biennial review (2025/2026) | |||
| Task/milestone | Notes | Key dates | Source of funds |
| Scope next biennial review | Develop workplan and key milestones for next review, will include developing new indicators and revisiting select indicators, engagement | Winter 2025 | Quality of Life Treasury Board Submission funding |
| Prepare and present proposal for next review | Seek endorsement from the interdepartmental committee | Spring 2025 | Quality of Life Treasury Board Submission funding |
| Launch engagement for next review | Focus will likely be on Indigenous perspectives and public opinion research | Fall 2025 to Winter 2026 | Quality of Life Treasury Board Submission funding |
| Summarize findings from the review | Draft report | Spring 2026 | Quality of Life Treasury Board Submission funding |
| Present findings from the review | Seek endorsement from the interdepartmental committee | Autumn 2026 | Quality of Life Treasury Board Submission funding |
| Disseminate report on the biennial review | Publish report in Winter 2027 | Quality of Life Treasury Board Submission funding | |
| Update Quality of Life Hub with endorsed changes | Work with indicator leads internally to draft updated Hub pages, update other Quality of Life communications products | Publish updated Hub pages in Winter 2027 | Quality of Life Treasury Board Submission funding |
Appendix B: Membership of the DG Committee on Quality of Life Measurement and Implementation
- Agriculture and Agrifood Canada
- Atlantic Canada Opportunity Agency
- Canada Revenue Agency
- Canadian Heritage
- Crown-Indigenous Relations Canada
- Department of Finance
- Employment and Social Development Canada
- Environment and Climate Change Canada
- Health Canada
- Housing, Infrastructure and Communities Canada
- Immigration, Refugees & Citizenship Canada
- Indigenous Services Canada
- Innovation, Science, Economic Development
- Natural Resources Canada
- Natural Sciences and Engineering Research Council and Social Sciences and Humanities Research Council
- Pacific Economic Development Canada
- Parks Canada
- PrairiesCan
- Privy Council Office
- Public Health Agency of Canada
- Public Safety Canada
- Statistics Canada *Co-chair
- Treasury Board of Canada Secretariat *Co-chair
- Date modified: