
Quality of Life Hub
Welcome to Canada's Quality of Life Hub. Learn about Canada's Quality of Life Framework, and find the latest releases, data publications, and reference material on subjective and objective measures of wellbeing.
Canada's Quality of Life Framework
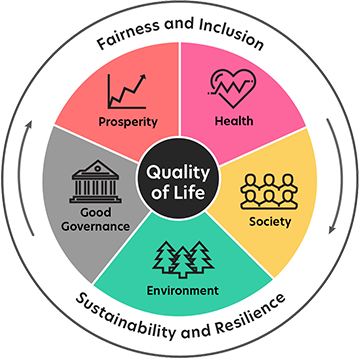
The Quality of Life Framework for Canada brings together data for ninety-one indicators, spread across five domains and three central indicators (as shown in the Quality of Life Framework for Canada infosheet).
The framework also includes two cross-cutting lenses, which are applied across all the domains in the framework:
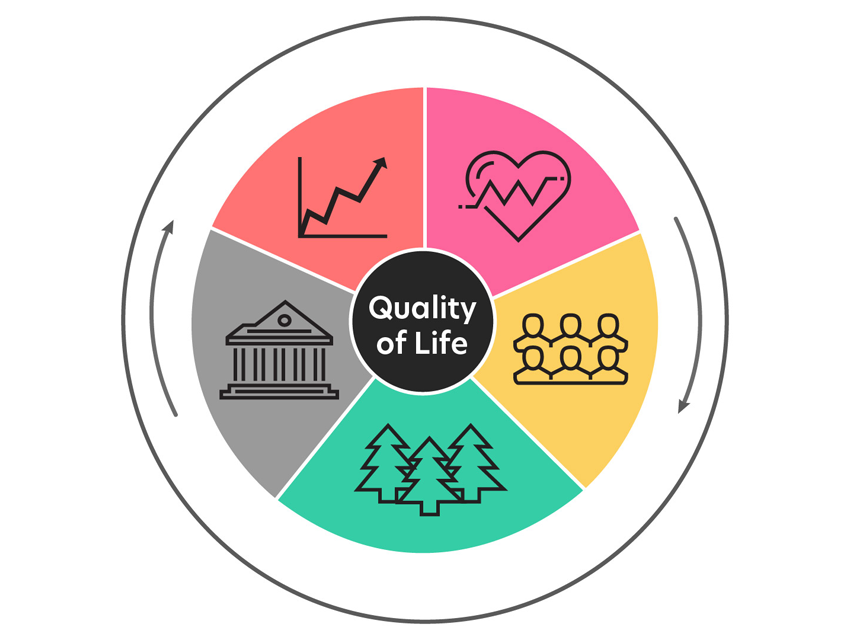
Description - Quality of life identifier
This image illustrates the Quality of Life Framework for Canada. It is represented as a circular graphic with the term "Quality of Life" in a circle at its centre. The circular graphic is divided into five segments which represent each of the five domains of the framework: Prosperity, Health, Society, Environment, and Good Governance. Each domain is represented by an icon: Prosperity domain by an image of a line graph, Health by a heart and heartbeat (electrocardiogram) line, Society by a group of people, Environment by trees, and Good Governance by a courthouse. The two lenses of the framework, Fairness and Inclusion and Sustainability and Resilience, encircle the image, represented by curved arrows.
Interactive dashboards
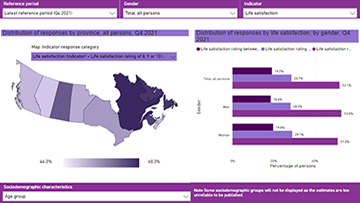 Selected indicators of quality of life in Canada
 Municipal Quality of Life Dashboard
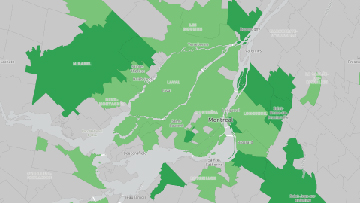 Quality of life indicators by census subdivision
Features

 Check out the first Special Edition of Insights on Canadian Society!
The theme for this issue is social geography—how social phenomena are distributed across Canada, and how that distribution shapes us.
Domains and headline indicators
Consult the latest data on the headline indicators below to gain a snapshot of Canada's quality of life. Select the domain name to learn more about the indicators within it.
 Central indicators
Key indicators for Central indicators
Life satisfaction
46.0%
reported high life satisfaction in Q4 2024
Sense of meaning and purpose
56.8%
reported high sense of meaning and purpose in Q4 2024
Future outlook
56.3%
reported always or often having a hopeful view of the future in Q4 2024
 Health
Key indicators for Health
Perceived health
52.2%
reported very good or excellent health in 2023
Perceived mental health
53.8%
reported very good or excellent mental health in 2023
 Prosperity
Key indicators for Prosperity
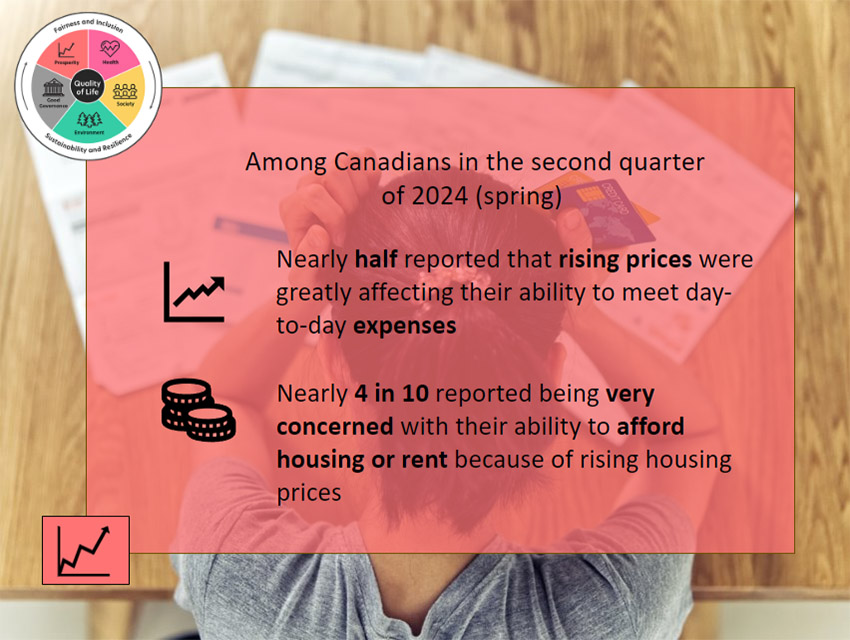
Making ends meet
29.5%
reported it was easy or very easy for their household to meet its financial needs in Q4 2024
Household income
$70,500
median after-tax income for economic families and persons not in an economic family in 2022
Employment
60.9%
employment rate in March 2025
Youth not in employment, education, or training (NEET)
12%
of youth aged 15 to 29 not in employment, education, or training in 2024
Acceptable housing
69.0%
of the population lived in acceptable housing in 2022
Core housing need
9.1%
of the population lived in core housing need in 2022
Poverty
10.2%
of the population lived below the poverty line in 2023
 Society
Key indicators for Society
Someone to count on
72.9%
reported always or often having people they can depend on when in need in Q4 2024
Sense of belonging to local community
53.5%
reported a very strong or somewhat strong sense of belonging to their local community in Q4 2024
Satisfaction with time use
41.7%
reported high satisfaction with how they use their time in 2022 and 2023
Trust in others
43.5%
reported most people can be trusted in Q4 2024
 Environment
Key indicators for Environment
Air quality
74%
of the population lived in areas within air quality standards in 2020 to 2022
Drinking water
35
long-term drinking water advisories on reserves as of March 2025
During 2025, 4 advisories have been added and 0 have been lifted
During 2024, 6 advisories were added and 4 were lifted
Greenhouse gas emissions
694 megatonnes
of carbon dioxide equivalent emitted in 2023
Conserved areas
Terrestrial areas
13.7%
conserved at end of 2023
Marine areas
14.7%
conserved at end of 2023
No change since 2022
 Good governance
Key indicators for Good governance
Perceptions of neighbourhood safety after dark
80.1%
reported feeling very or reasonably safe walking alone in their neighbourhood after dark in 2019
meaningful increase+1.4 points
Discrimination and unfair treatment
26.0%
reported discrimination or unfair treatment in Q4 2024
meaningful decrease-4.9 points
Confidence in institutions
In Q4 2024
63.4%
reported high confidence in the police
48.2%
reported high confidence in the justice system
45.0%
reported high confidence in the School system
36.2%
reported high confidence in the Canadian media
28.3%
reported high confidence in the Federal Parliament
Related resources
Visit other Statistics Canada subject hubs and portals for related data, analysis and information.
 Agriculture and Food
 Climate Change
 Energy
 Environment
 Gender, Diversity and Inclusion
 Health
 Indigenous Peoples
 Infrastructure
 Population and Demography
 Poverty
 Rural Canada
 Transportation
Feedback
- Date modified: